Webhooks Troubleshooting
You can choose to store the event data as a result of a failed webhook execution in JFrog Platform. You can also choose to set the webhook in debug mode so that the data is stored regardless of the status of the webhook execution. You need to Configure Webhooks Troubleshooting in Self-Hosted JFrog Platform when you create or edit a webhook in a Self-Managed JFrog Platform.
You can view the data in the Troubleshooting tab of the Webhooks screen in the JFrog Platform UI or use the Webhooks Troubleshooting API to retrieve the events.
In the Self-Managed JFrog Platform, you can view the Troubleshooting tab or use the API, only if you use Redis to store troubleshooting data.
Webhooks troubleshooting data is available in the JSON format. For more information, see Webhooks Troubleshooting Data Format
View Webhooks Troubleshooting Data in the UI
-
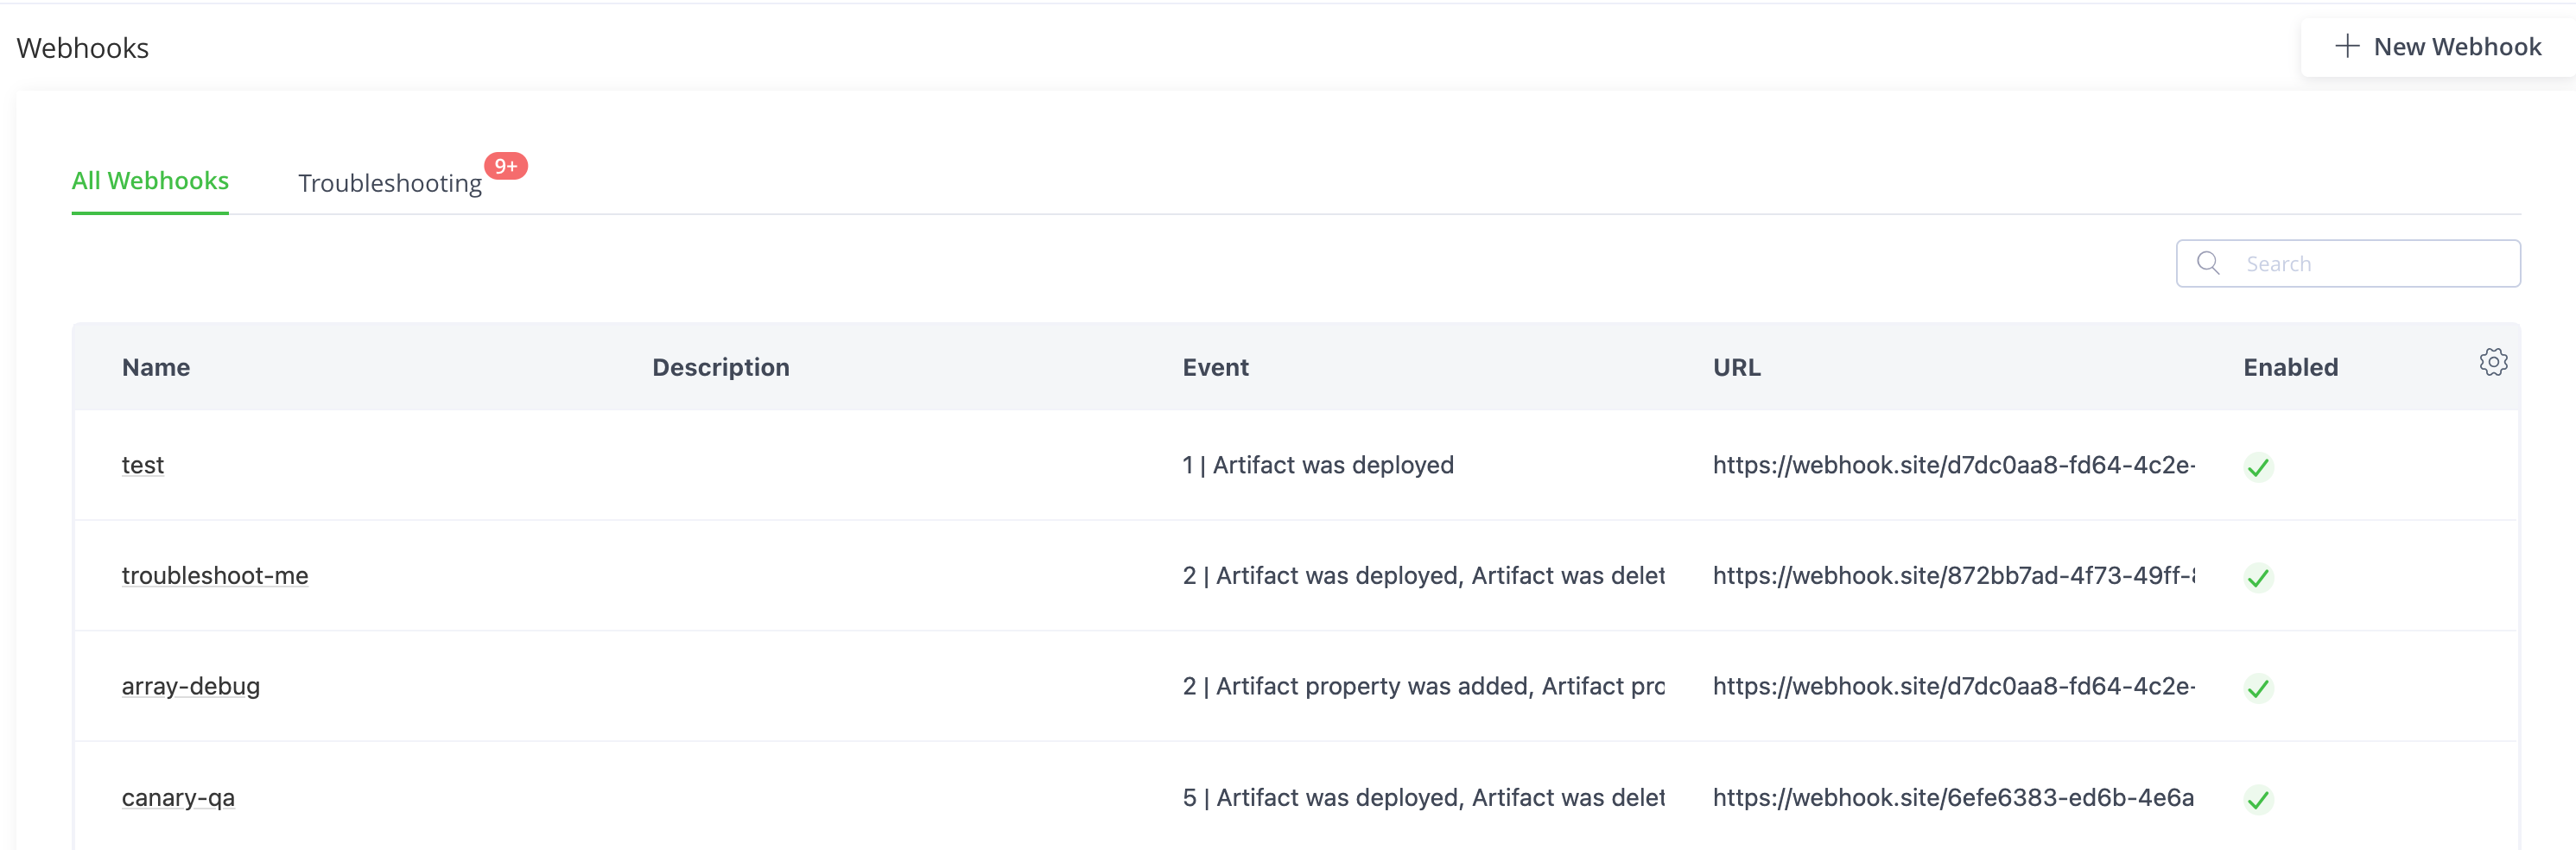
Select the Platform module, then select Integrations > Webhooks.
-
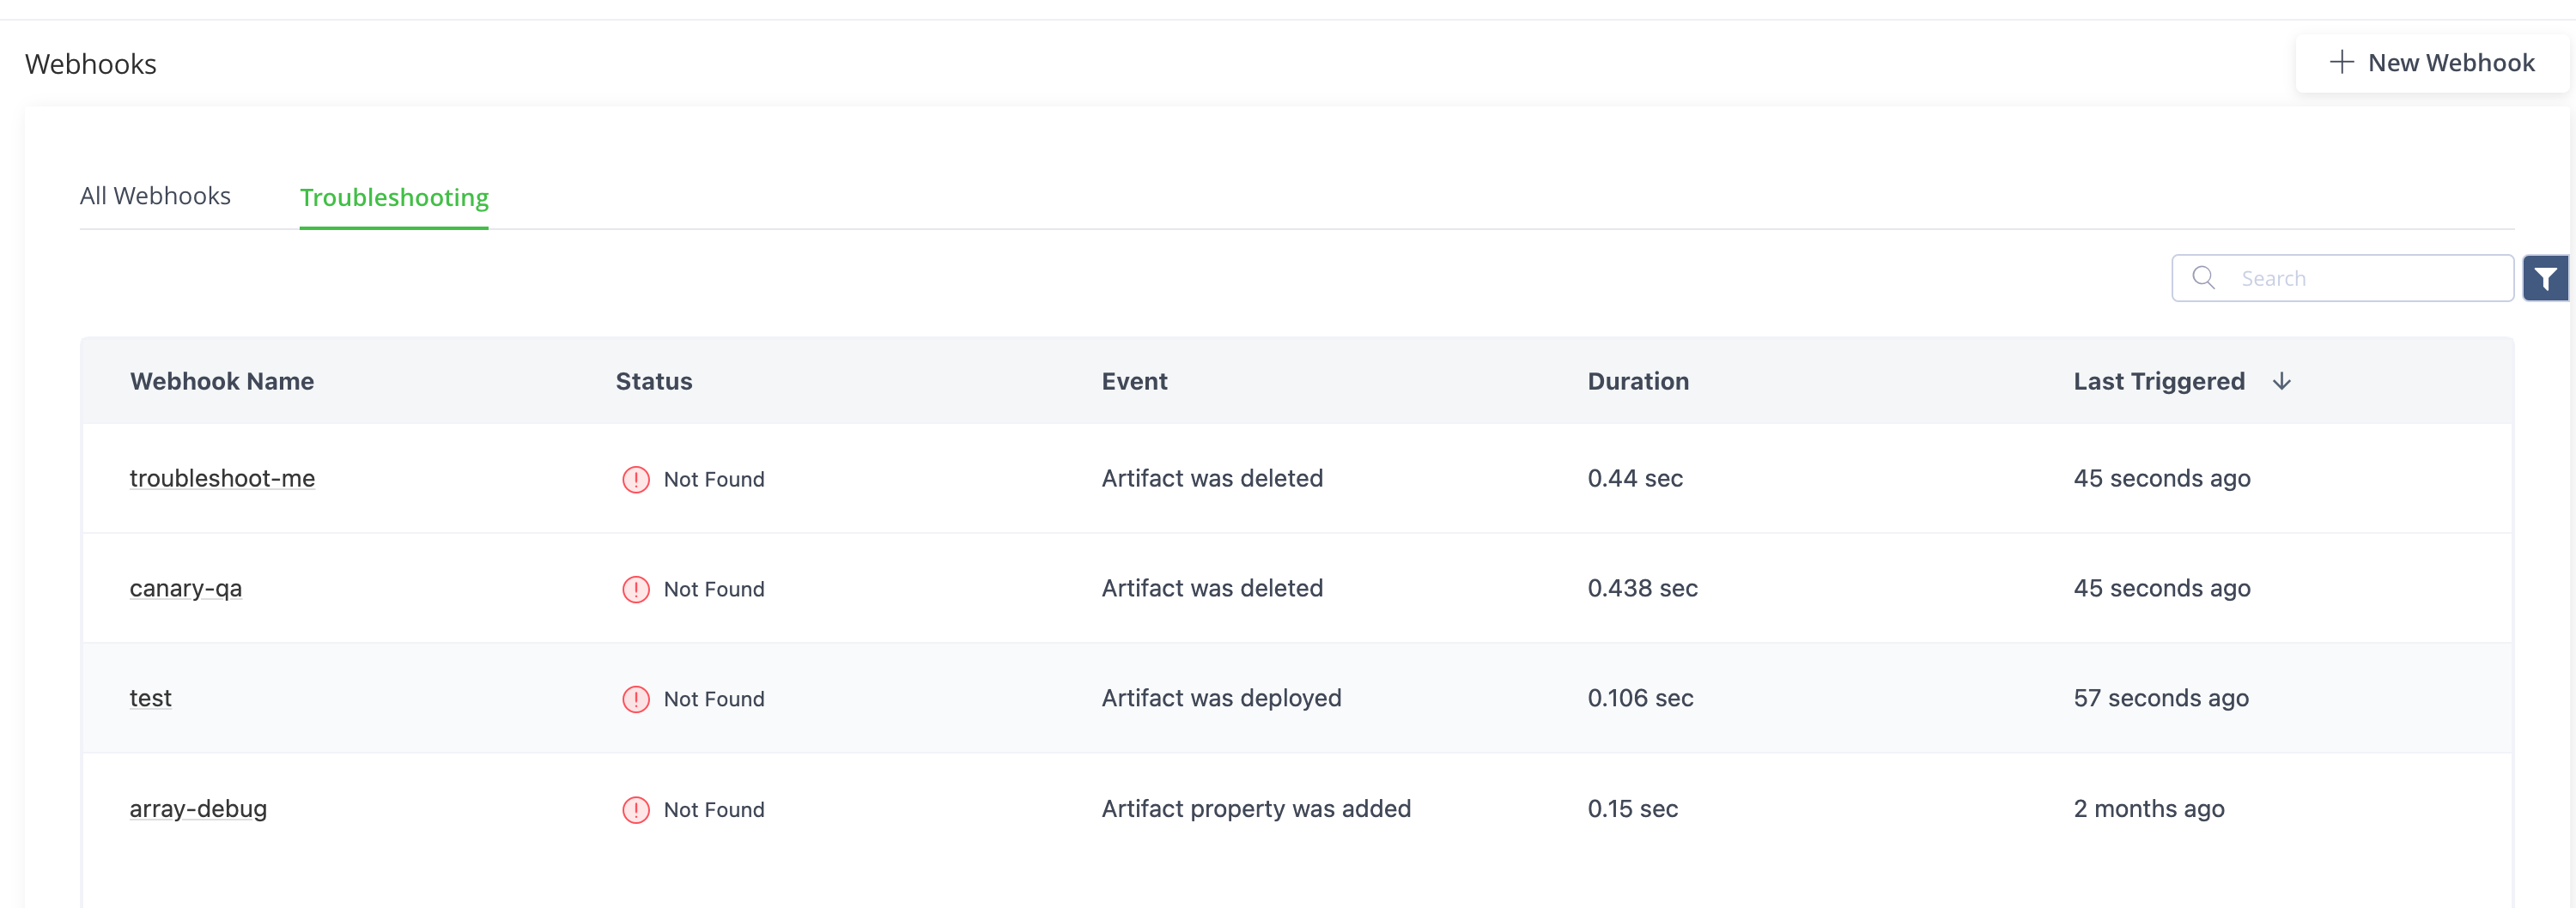
Click the Troubleshooting tab.
-
You can view information about the last event of the configured webhooks.
-
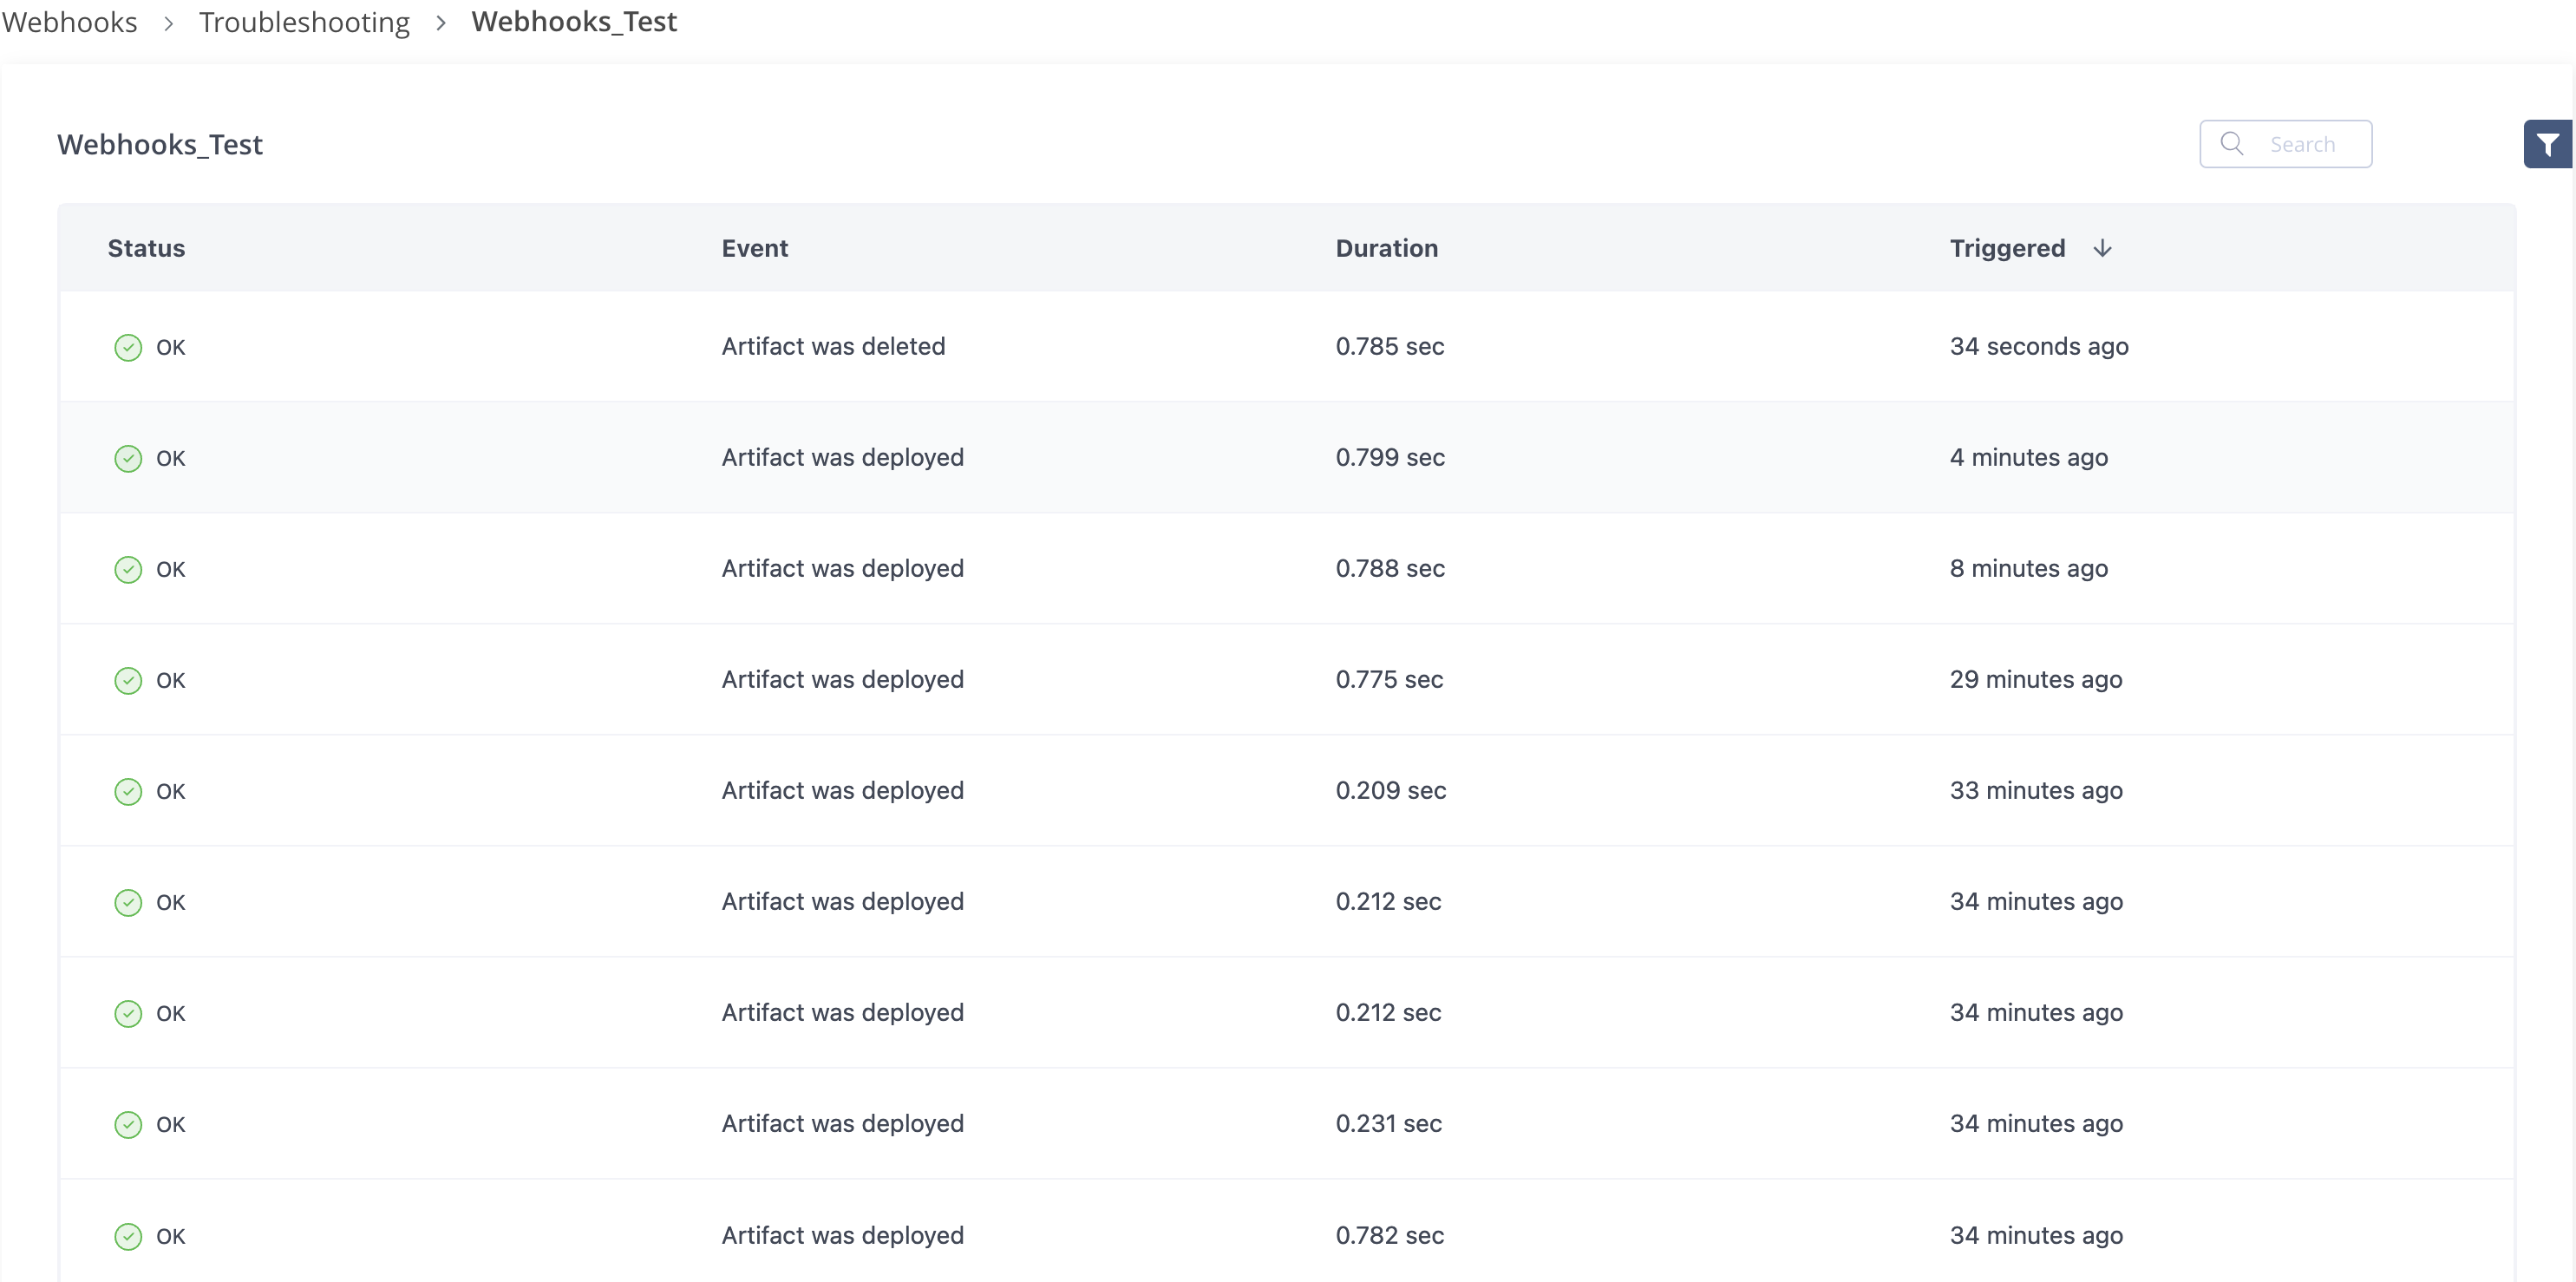
Click a webhook to view the details of all the events of that particular webhook.
-
To sort webhooks according to project, click the Projects column.
-
Optionally, click the Filter button to filter the results by the status.
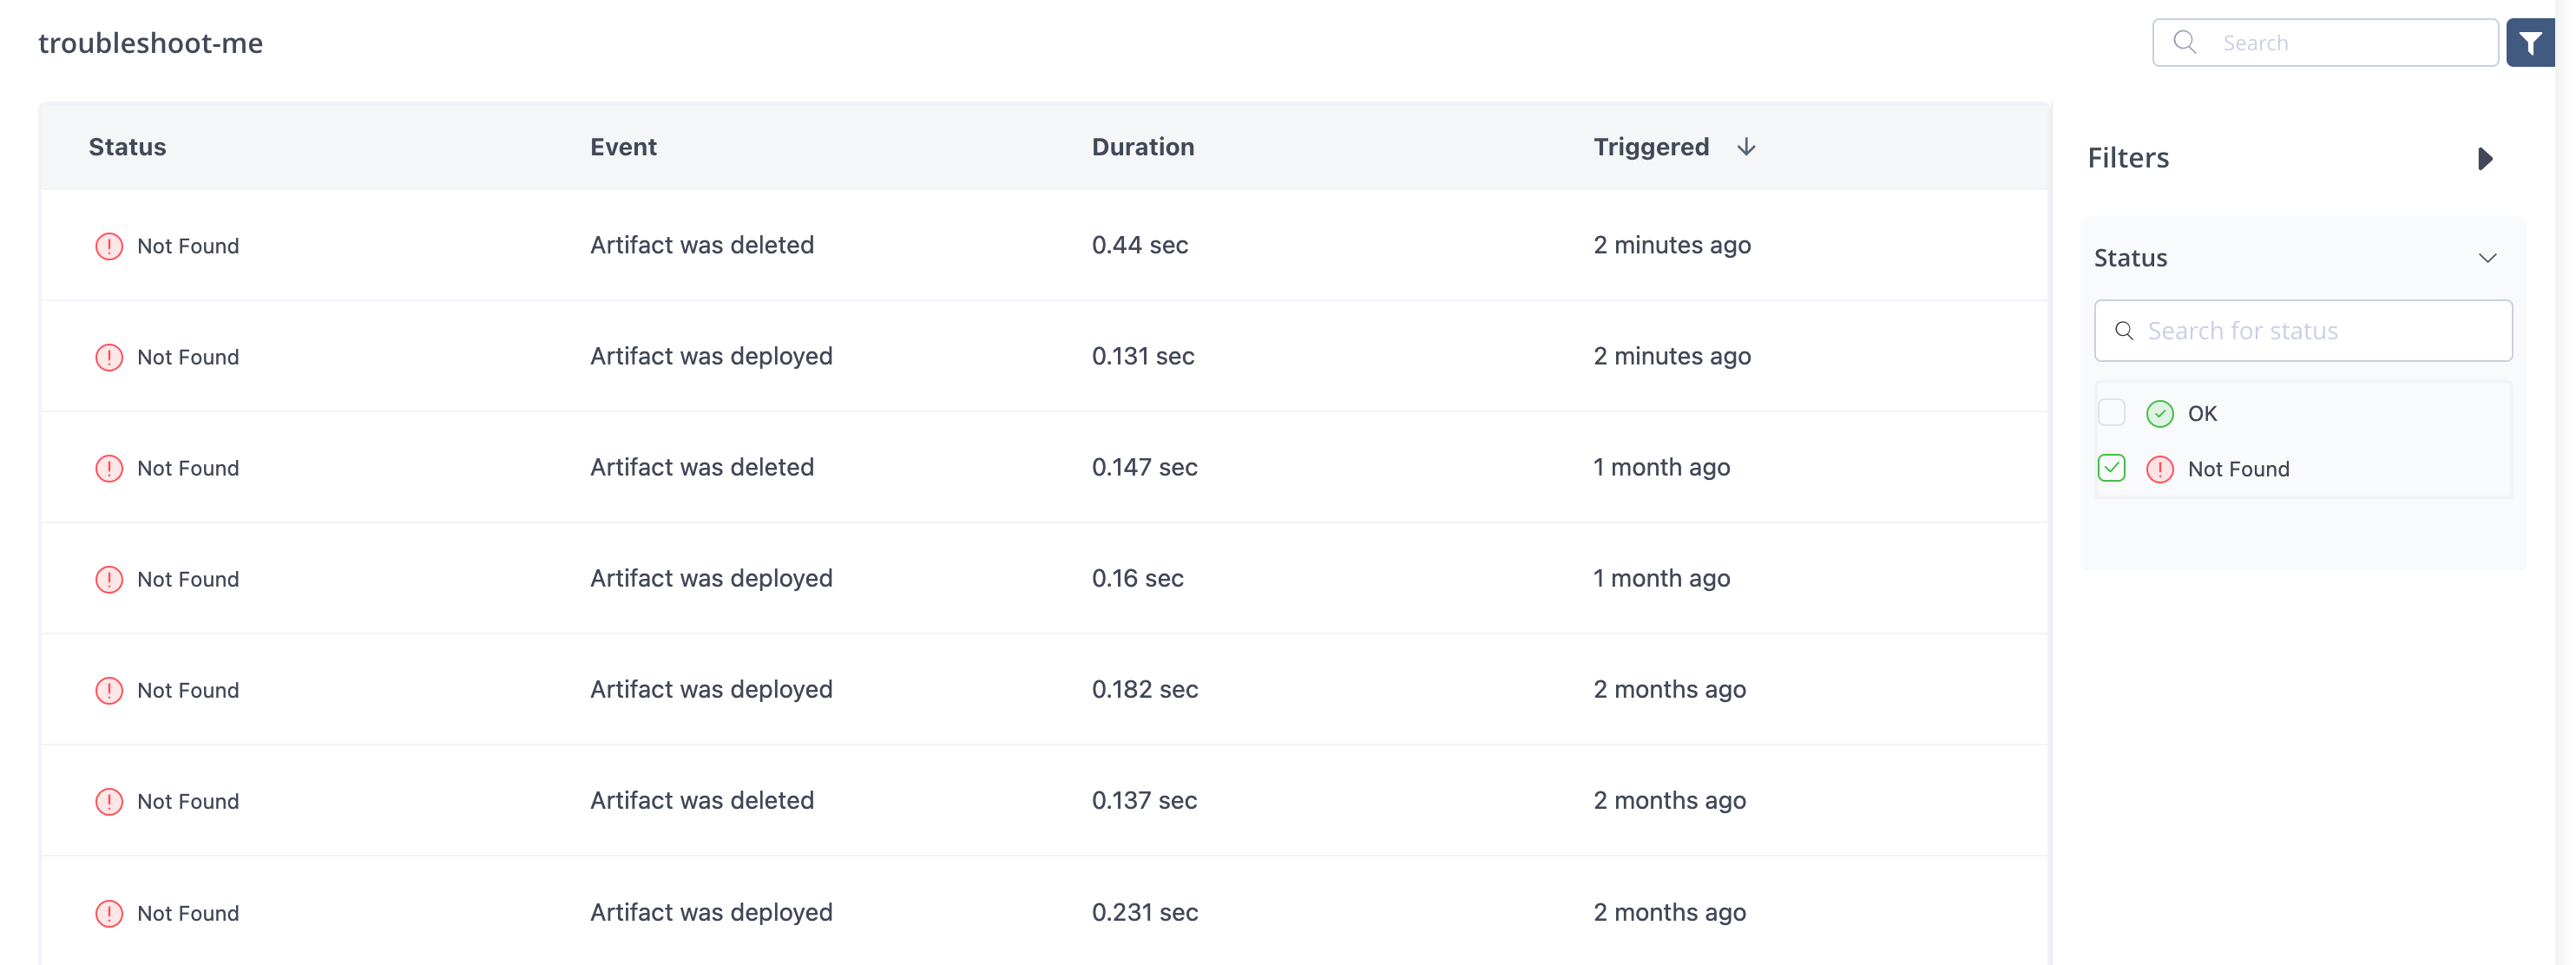
The list displays only those statuses that are applicable to the current webhook runs.
-
Click on any of the events to view the detailed event status.
A pane appears with the details of the event. The Request tab appear by default and shows the webhook request details.
-
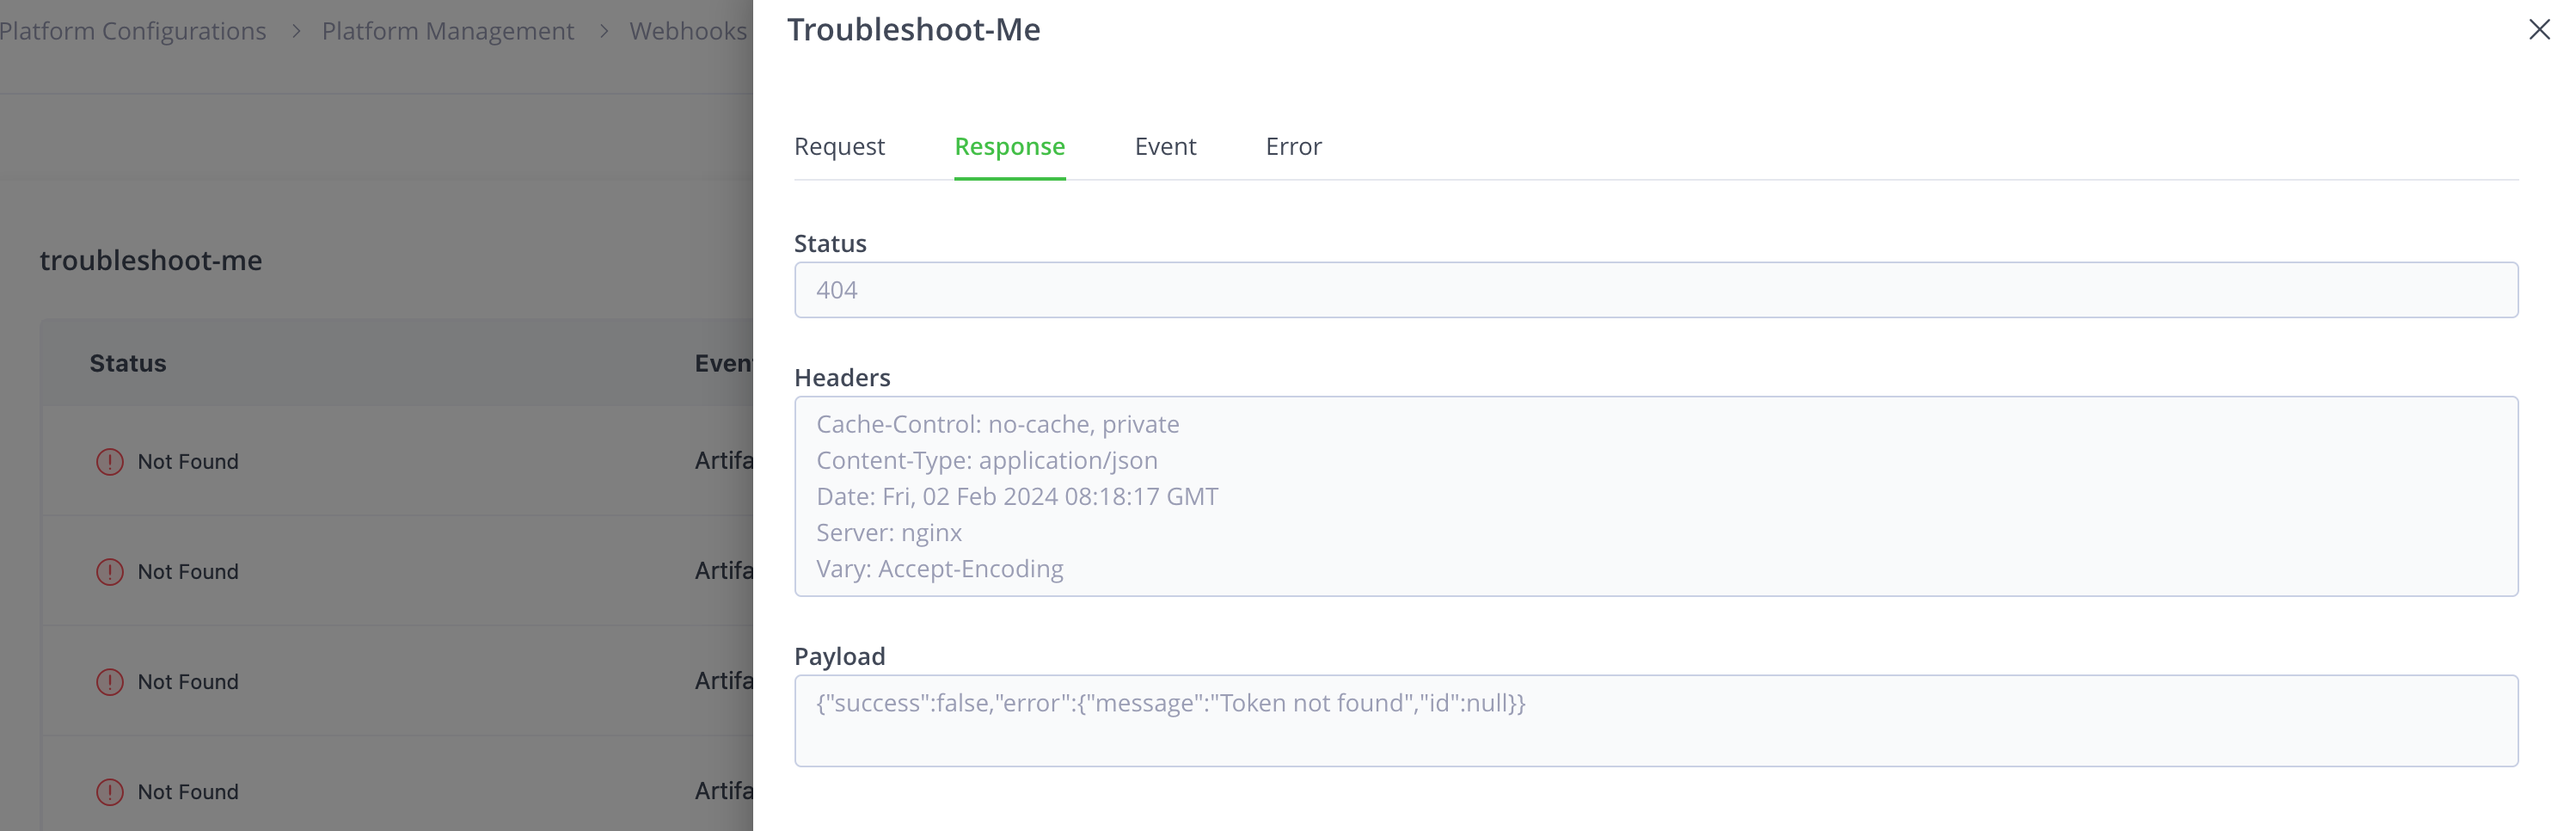
Click the Response tab to view the response header, payload, and status from the receiver.

-
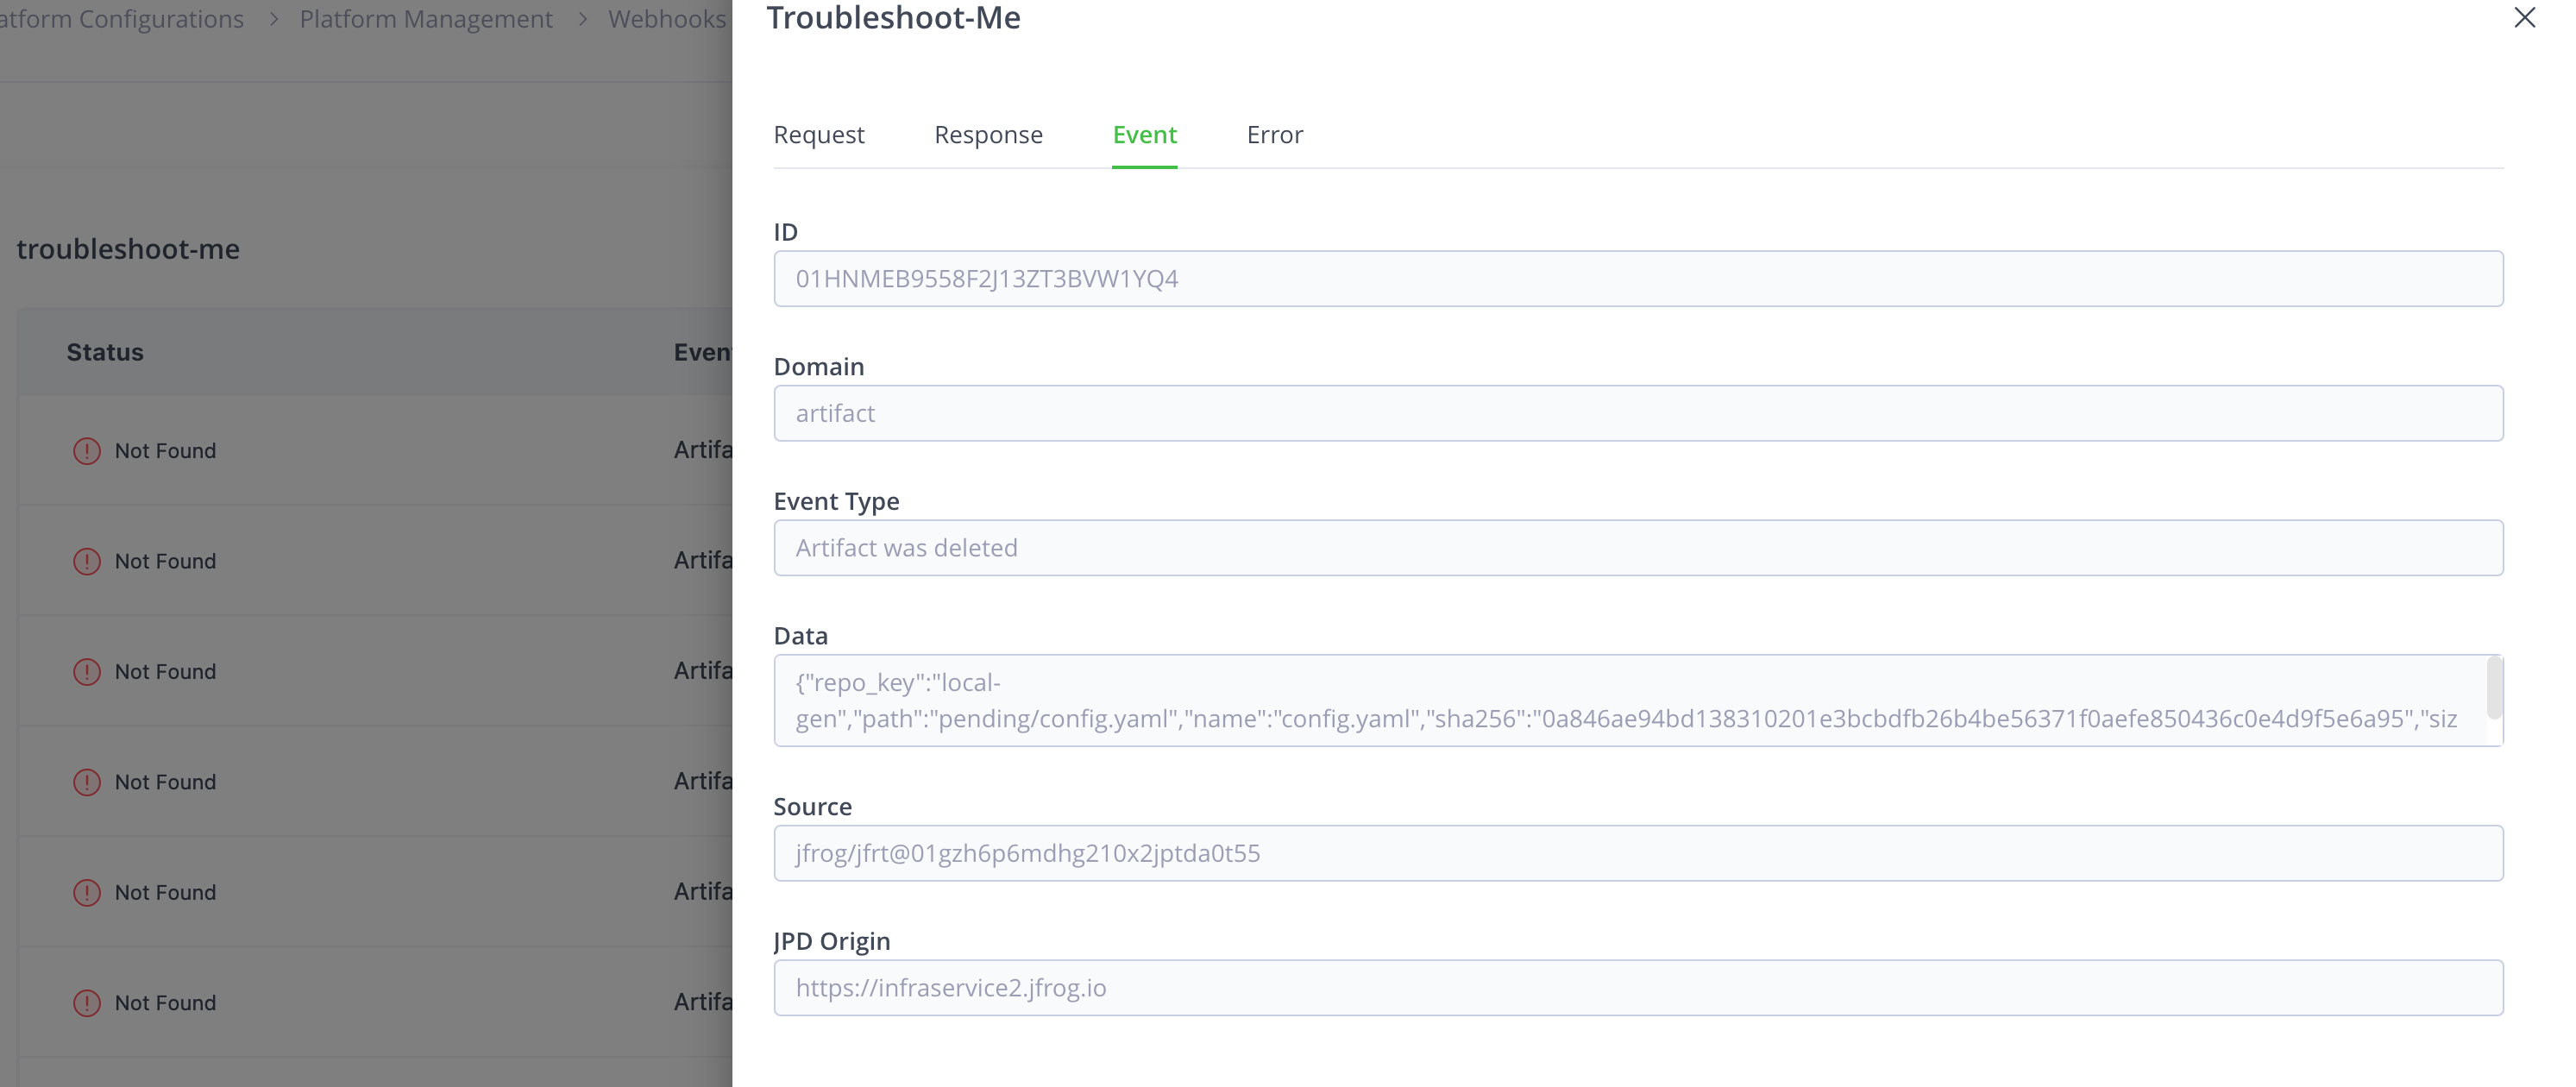
Click the Event tab to view the event details.
-
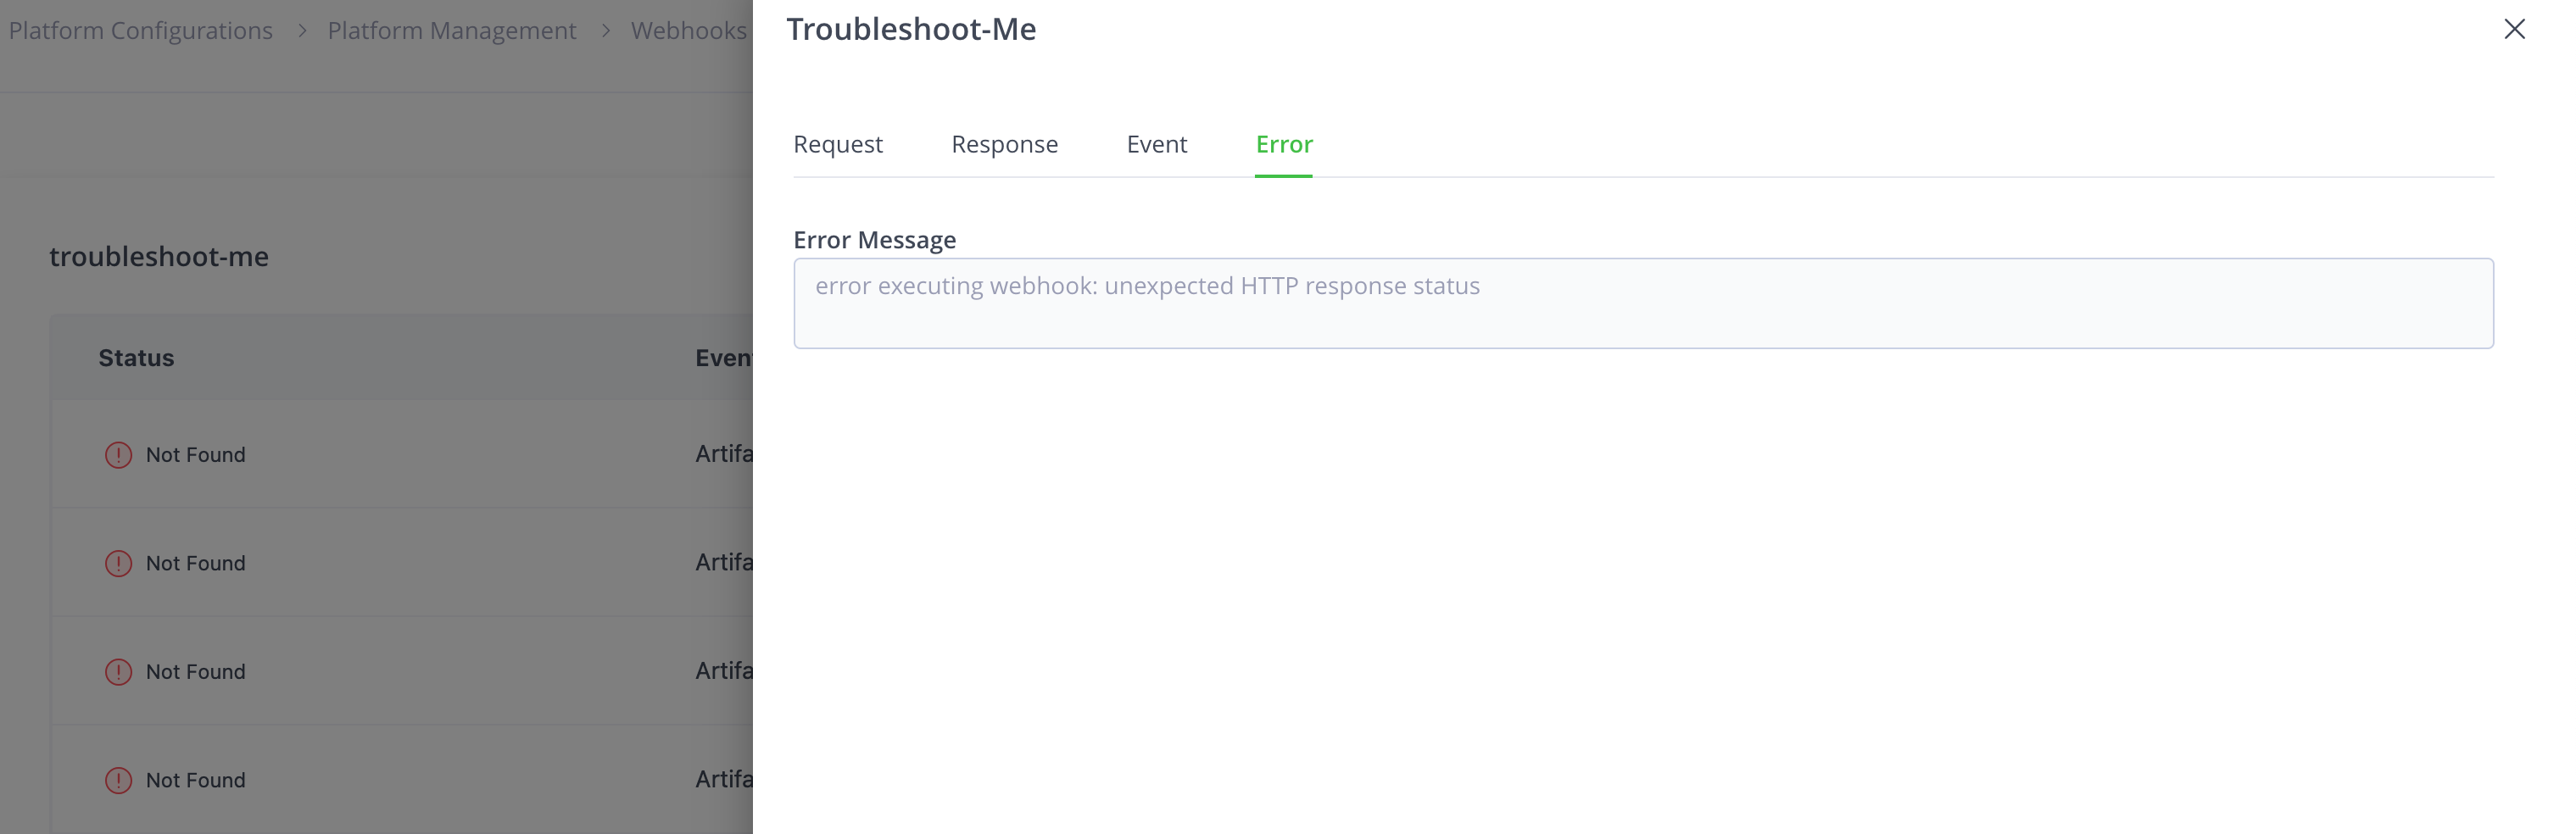
Click the Error tab to view the error message.
-
In Self-Hosted JFrog Platform, you can view the Troubleshooting tab or use the API, only if you use Redis to store troubleshooting data.
Webhooks Troubleshooting Data Format
The webhooks troubleshooting data is generated as a JSON data object in the following format.
| Field | Description |
|---|---|
| timestamp | The timestamp at which the handling of the webhook event started in UNIX format. |
| elapsed_time | The duration of the handling of the event in milliseconds. |
| errors | A list of errors encountered while handling the event. |
| request | An object containing details of the request that is sent to the target, including the body. |
| response | An object containing the details of the response received from the target. |
| event | An object containing the details of the event that triggered the webhook, including the raw data. |
The following JSON object is an example of the troubleshooting data.
{
   "timestamp": 1694520528315,
   "elapsed_millis": 208,
   "errors": [
       "error executing webhook: unexpected HTTP response status"
   ],
   "request": {
       "method": "POST",
       "url": "https://webhook-target/a9736bc8",
       "headers": {
           "Content-Type": "application/json"
       },
       "payload": "{\"domain\":\"artifact\",\"event_type\":\"deployed\",\"data\":{\"repo_key\":\"example-repo-local\",\"path\":\"some.log\",\"name\":\"some.log\",\"sha256\":\"069092736c73613a25917f582f8a2621b8495cb723914c85dc570761ce0846f8\",\"size\":353178},\"subscription_key\":\"test\",\"source\":\"jfrog/jfrt@01h9mspg5atsp402qqxm071zjv\"}",
       "retries_attempted": 0
   },
   "response": {
       "status": 404,
       "headers": {
           "Cache-Control": "no-cache, private",
           "Content-Type": "application/json",
           "Date": "Tue, 12 Sep 2023 12:08:48 GMT",
           "Server": "nginx",
           "Vary": "Accept-Encoding"
       },
       "body": "{\"success\":false,\"error\":{\"message\":\"Alias a9736bc8 not found\",\"id\":null}}"
   },
   "event": {
       "id": "01HA4MPK6XVKTD0XMS9SVM1GER",
       "subscription_key": "test",
       "domain": "artifact",
       "event_type": "deployed",
       "data": "{\"repo_key\":\"example-repo-local\",\"path\":\"some.log\",\"name\":\"some.log\",\"sha256\":\"069092736c73613a25917f582f8a2621b8495cb723914c85dc570761ce0846f8\",\"size\":353178}",
       "source": "jfrog/jfrt@01h9mspg5atsp402qqxm071zjv"
   }
}
Configure Webhooks Troubleshooting in Self-Hosted JFrog Platform
In a Self-Hosted installation, you can choose to store the data in a Redis database or a log file.
In the Self-Hosted JFrog Platform, you can view the Troubleshooting tab or use the API, only if you use Redis to store troubleshooting data.
Add the following entry to the Artifactory System YAML to store the data in a log file.
event:
  troubleshooting:
    enabled: true
    storageType: log
If you choose to store the data in a log file, the file is available at: JFROG_HOME/var/log/event-troubleshooting.log.
The log file stores the results of all the failures of webhooks executed by the node. If you have several webhook events that trigger frequently, you may need to set up log rotation to manage the size of the log file.
Add the following entry to the Artifactory System YAML to store the data in a Redis database.
event:
  troubleshooting:
    enabled: true
    storageType: redis
You should set up a Redis database in the same network as the JFrog Platform installation and update the Artifactory System YAML with Redis configuration information. JFrog Platform supports Redis 7.2.
## SHARED CONFIGURATIONS
## A shared section for keys across all services in this config
shared:
  cache:
    ## Cache URL, such as redis://host:port or memcached://host:port
    ## URL supports multiple host and port for sentinel/cluster support
    url: redis://<host>:<port>
    ## Cache parameters
    params: password=<password>;mode=<single/sentinel/cluster>
If you choose to store data in Redis, 10000 records are stored at a time. If there are more than 10000 records, the older entries are cleared every 30 seconds.
Update the cleanupIntervalMillis and streamMaxLen parameters in the Artifactory System YAML to modify these values.
event:
  troubleshooting:
    enabled: true
    storageType: redis
      cleanupIntervalMillis: 30000
      ##Clean up interval in milliseconds
      streamMaxLen: 10000
Updated 17 days ago