Pipelines-Dynatrace Reference Design
The JFrog Pipelines and Dynatrace Reference Design enables DevOps teams to better manage the development and delivery of software from code to production. In particular, it allows teams to use Dynatrace to track and tag deployment events for improved troubleshooting of applications and services running in production. Dynatrace automatically detects component versions allowing and centralizing this release-relevant data into a release inventory dashboard where releases by environment, open issues, and security vulnerabilities can be easily analyzed. The Dynatrace integration also opens up the use case of “monitoring as code” where Service Level Objectives, dashboards, and alerts are all managed with JFrog Pipelines and the Dynatrace configuration APIs.
If you need help with this integration, contact [email protected]
Benefits
- Enhance monitoring and troubleshooting of applications and services running in production environments by correlating and tracing performance degradations to specific build updates, deployments, and commits collected through metadata provided by JFrog Pipelines.
- Accelerate problem resolution and reduce finger-pointing by using detailed contextual data on deployment events including build and git-related information to enable faster resolution of issues.
- Reduce time spent on manual processes by simplifying and standardizing Kubernetes deployments and introducing self-service Dynatrace monitoring as code.
Prerequisites
- An active Dynatrace free SaaS trial or license
- A JFrog Artifactory Pro (or higher) license or free SaaS DevOps subscription
- A GitHub account
- A Kubernetes cluster with admin permissions
Pipelines-Dynatrace Reference Design Configuration Overview
The JFrog Pipeline and Dynatrace reference design leverages a series of built-in integrations and custom bash scripts available within the JFrog Pipelines platform, that enable users to build a Docker image and deploy it to a Kubernetes cluster instrumented with the Dynatrace OneAgent Operator. As this is done, Dynatrace deployment events are sent to the associated service being monitored in the runtime environment with the important context and hyperlink back to the JFrog pipeline job that performed the deployment.
The reference design uses a number of repositories, integrations and pipelines. This section reviews the different tasks involved with integrating Dynatrace.
JFrog Repositories used in the Reference Design
The following set of Artifactory Repositories are used in the reference design:
Integrations used in the Reference Design
Integrations connect Pipelines to an external service/tool. Each integration type defines the endpoint, credentials, and any other configuration detail required for Pipelines to exchange information with the service. Below are the integrations used in this reference design:
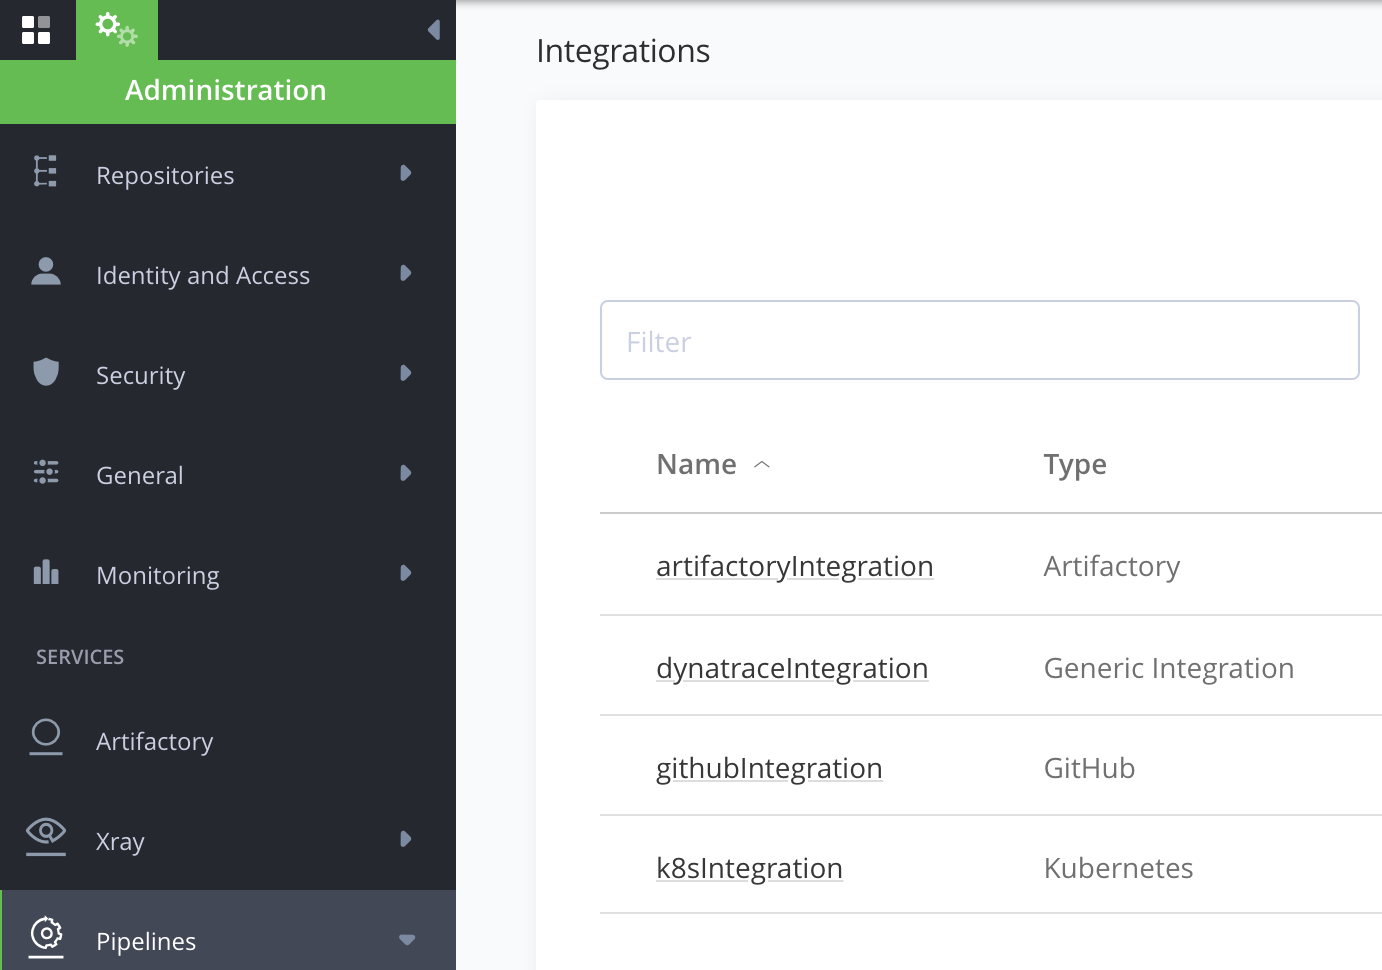
| Integration Name | Type | Description |
| artifactoryIntegration | Artifactory Integration or JFrog Platform Access Token Integration | Stores the Artifactory URL and Token. |
| k8sIntegration | Kubernetes Integration | Stores the configuration YAML to access Kubernetes cluster connection. |
| githubIntegration | GitHub Integration | Stores the GitHub URL and User Access Token the GitHub account where the pipeline code is stored. The GitHub user must have admin rights for the Pipelines repository. |
| dynatraceIntegration | Generic Integration | Stores the Dynatrace instance URL and API token. The API token is configured with the permissions for any APIs it calls. The reference design API permissions are defined as lower in this document. |
Pipeline Steps used in the Reference Design
The reference JFrog Pipelines executes the following pipelines steps as shown in the JFrog picture below.
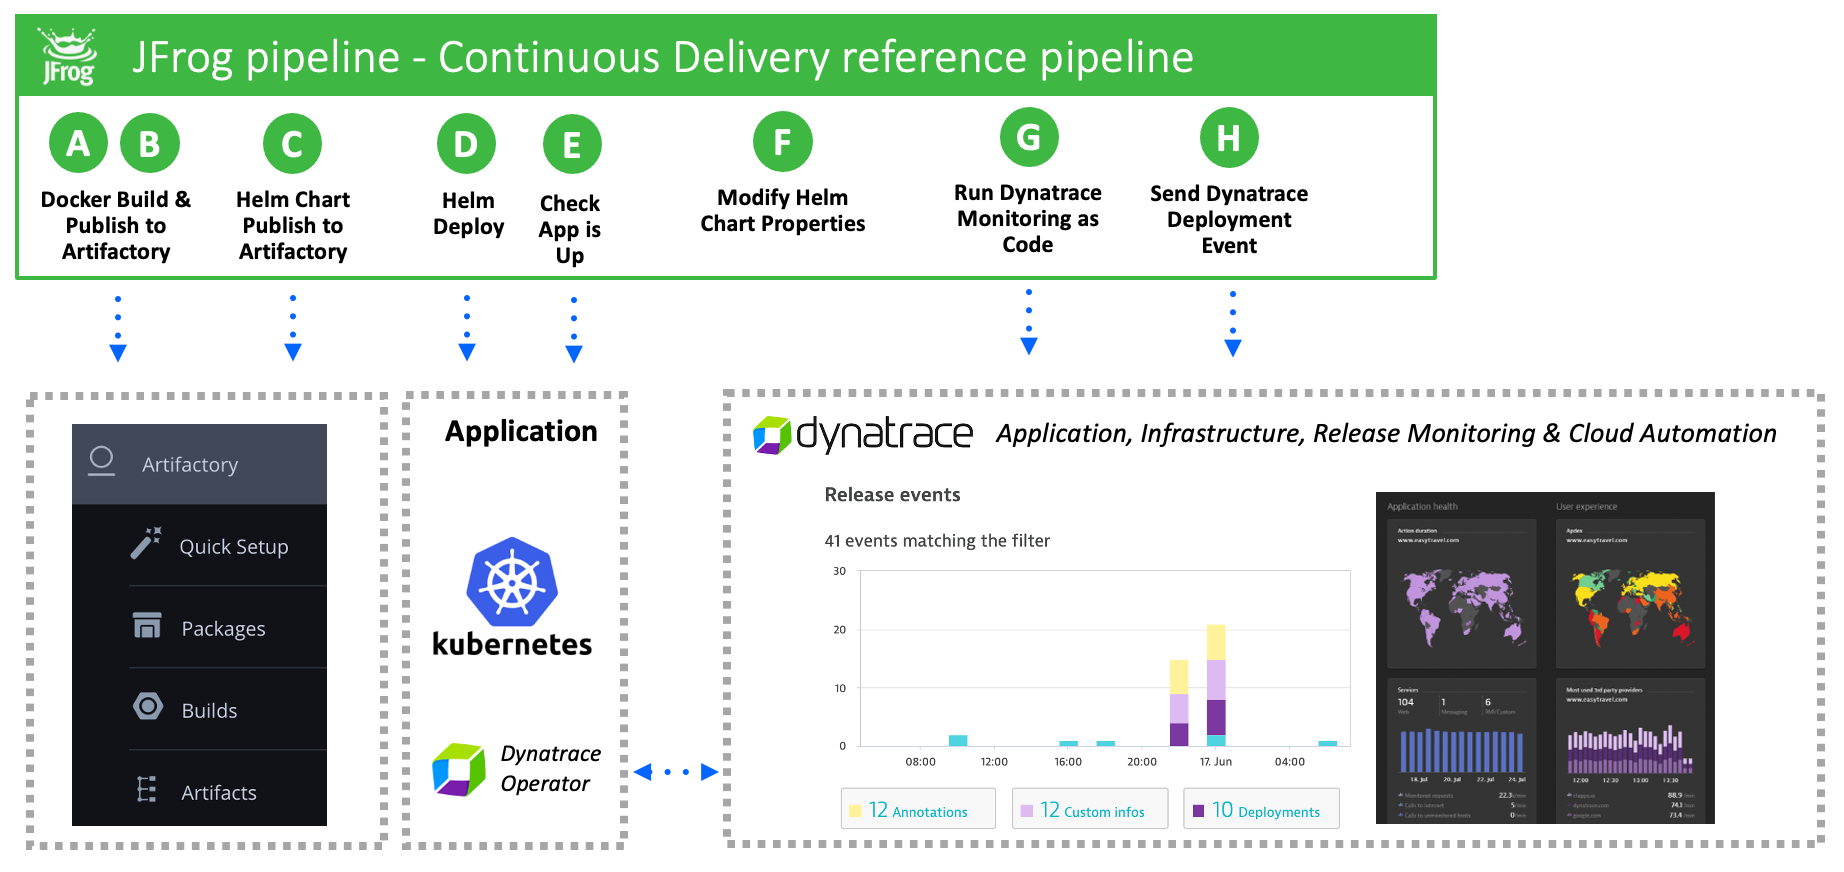
- DockerBuild: Native JFrog Pipelines step that builds a docker image from a Dockerfile and source code within the githubIntegration repo. This step uses the artifactoryIntegration to connect to the Artifactory instance so that the built image is available to the DockerPush step.
- DockerPush: Native JFrog Pipelines step that publishes the Docker image to an Artifactory local Docker repository. Uses theartifactoryIntegration to push the image to the Artifactory instance.
- HelmPublish: Native JFrog Pipelines step that uses the Helm chart in the githubIntegrationrepo and modifies it with the desired Docker image and tag to deploy. Pushes the updated Helm Chart to the Artifactory local Helm repository.
- HelmDeploy: Native JFrog Pipelines step that installs the published Helm chart to the Kubernetes cluster defined in the k8sIntegration. This step will also output the status of the deployed pods.
- AppUpCheck: Using the JFrog Pipelines Bash step type, this step calls a custom bash script that checks whether the passed-in URL is reachable. It will try a few times with a delay between attempts and will return with 'exit 1' if the URL is not reachable.
- ConfigureDynatrace: Using the JFrog Pipelines Bash step type, this step calls a custom bash script that will run a Docker image with the Dynatrace monitoring as code CLI. The githubIntegration repo is mounted as a volume so that the monitoring-as-code CLI can access the YAML and JSON configuration files that it will process. Dynatrace credentials are read from the dynatraceIntegration.
- ModifyHelmChartProperties: Using the JFrog Pipelines Bash step type, this step calls a custom bash script that calls the JFrog API to add custom properties to Helm chart in the repository. This step uses data from the previous step and adds it to the chart file properties. Artifactory credentials are read from theartifactoryIntegration.
- PostDynatraceEvent: Using the JFrog Pipelines Bash step type, this step calls a custom bash script that sends the custom deployment event to the Dynatrace instance using the Dynatrace API. Dynatrace credentials are read from the dynatraceIntegration.
Pipelines Dynatrace - Fork GitHub Repo and Create Access Token
In preparation for setting up the pipelines and running them, you will first need to make a copy of the reference design GitHub code repository. This assumes you have a GitHub account.
-
Fork the sample JFrog Pipeline-Dynatrace repository to your own repository.
-
Adjust the values.yaml file with values for your environment. You must adjust:
- gitRepo.path- replace dt-demos with your GitHub username or org name
- image.ImageName- replace dynatracedemos with your Artifactory account name
-
Create a GitHub Personal Access Token in the GitHub account for the GitHub pipeline repo according to the GitHub Integration document. Copy the generated token to a safe location. This Token is needed in the upcoming section for the pipeline GitHub integration setup.
Set up the Pipeline for Dynatrace
To complete the setup of the pipeline, JFrog integrations, repositories, and a pipeline source needs to be added.
Important
The reference pipeline within the repo, pipelines.yml, assumes the names for the integrations and repositories match names from the table in the Design Reference section and as described below are used. You are welcome to use different names, but you must adjust the pipelines.yml too else the pipeline will fail.
Configuration Overview
To set up the Pipeline for Dynatrace:
| Task | Description | For more information, see... | |
|---|---|---|---|
| 1 | Add integrations | Add a GitHub JFrog integration from the JFrog Administration panel | Set up the Pipeline for Dynatrace - Add Integrations |
| 2 | Add repositories | Add Docker repositories in the Artifactory Administration page. | Set up the Pipeline for Dynatrace - Add Repositories |
| 3 | Add a Pipeline Source | Create a new GitHub Pipeline source for the new repository. | Set up the Pipeline for Dynatrace - Add a Pipeline Source |
Set up the Pipeline for Dynatrace - Add Integrations
-
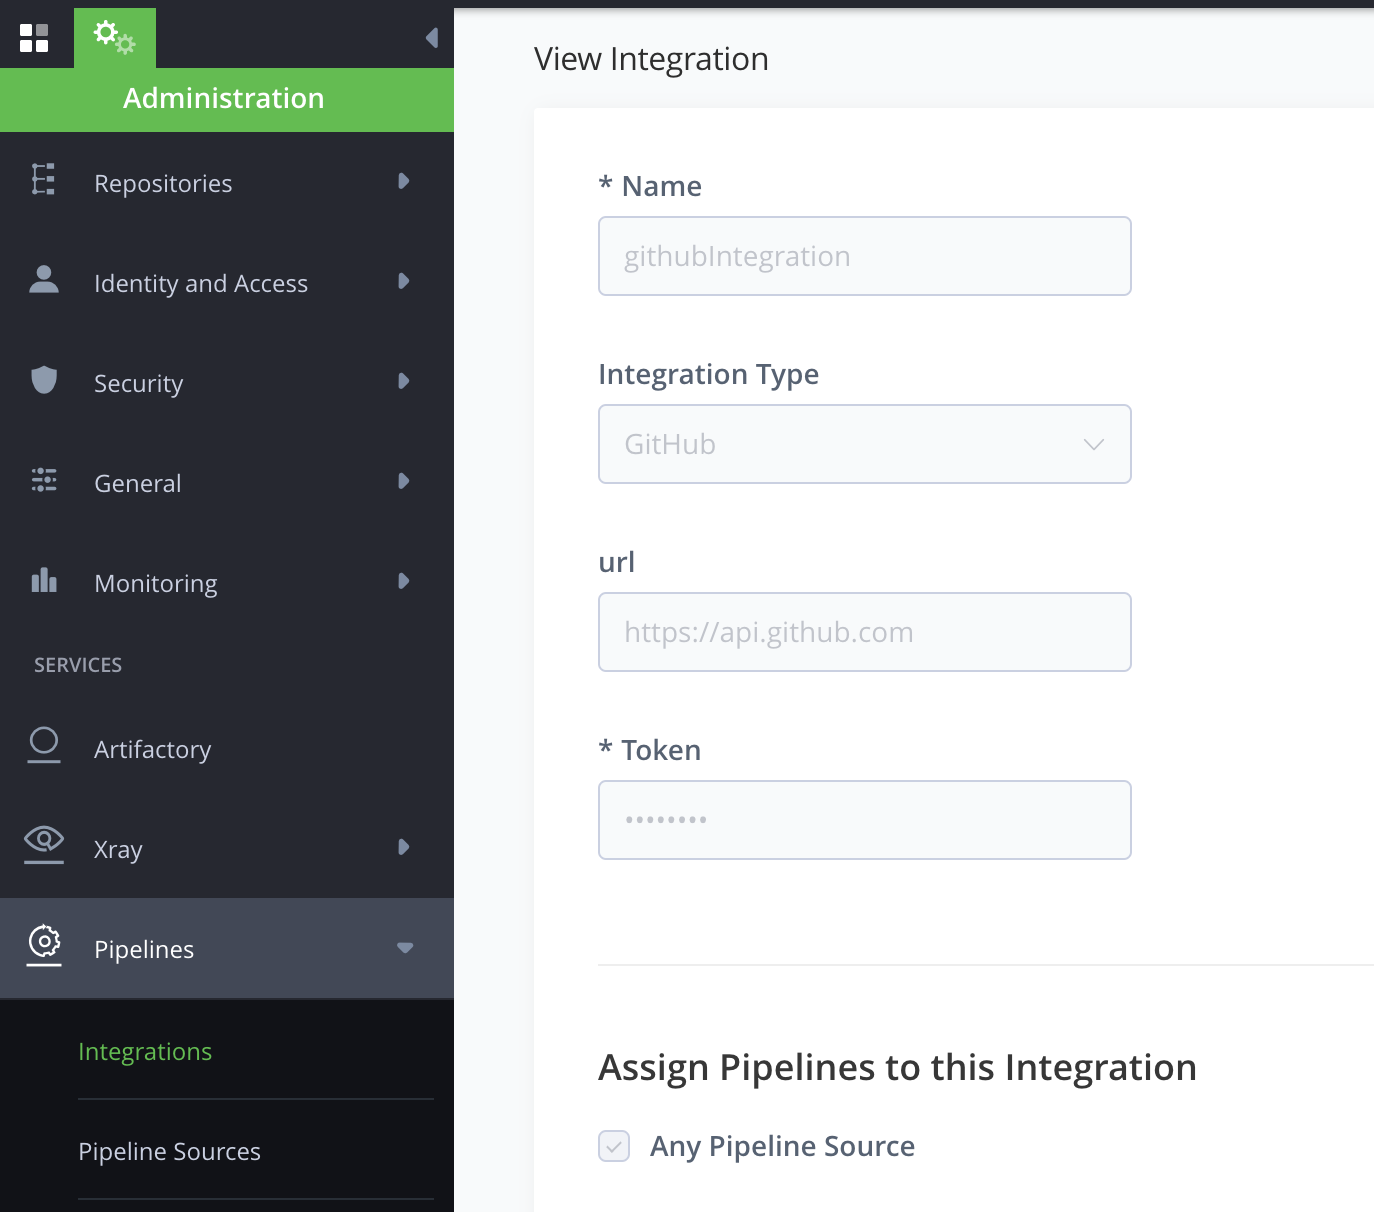
Add a GitHub JFrog Integration from the JFrog Administration panel. From the Administration page, select Integrations and then click the ‘Add Integrations’ button. On the form, fill in with these values as shown below.
-
Name = githubIntegration
-
Type = pick ‘GitHub’ from the drop-down list
-
Token = Your GitHub Personal Access Token
-
-
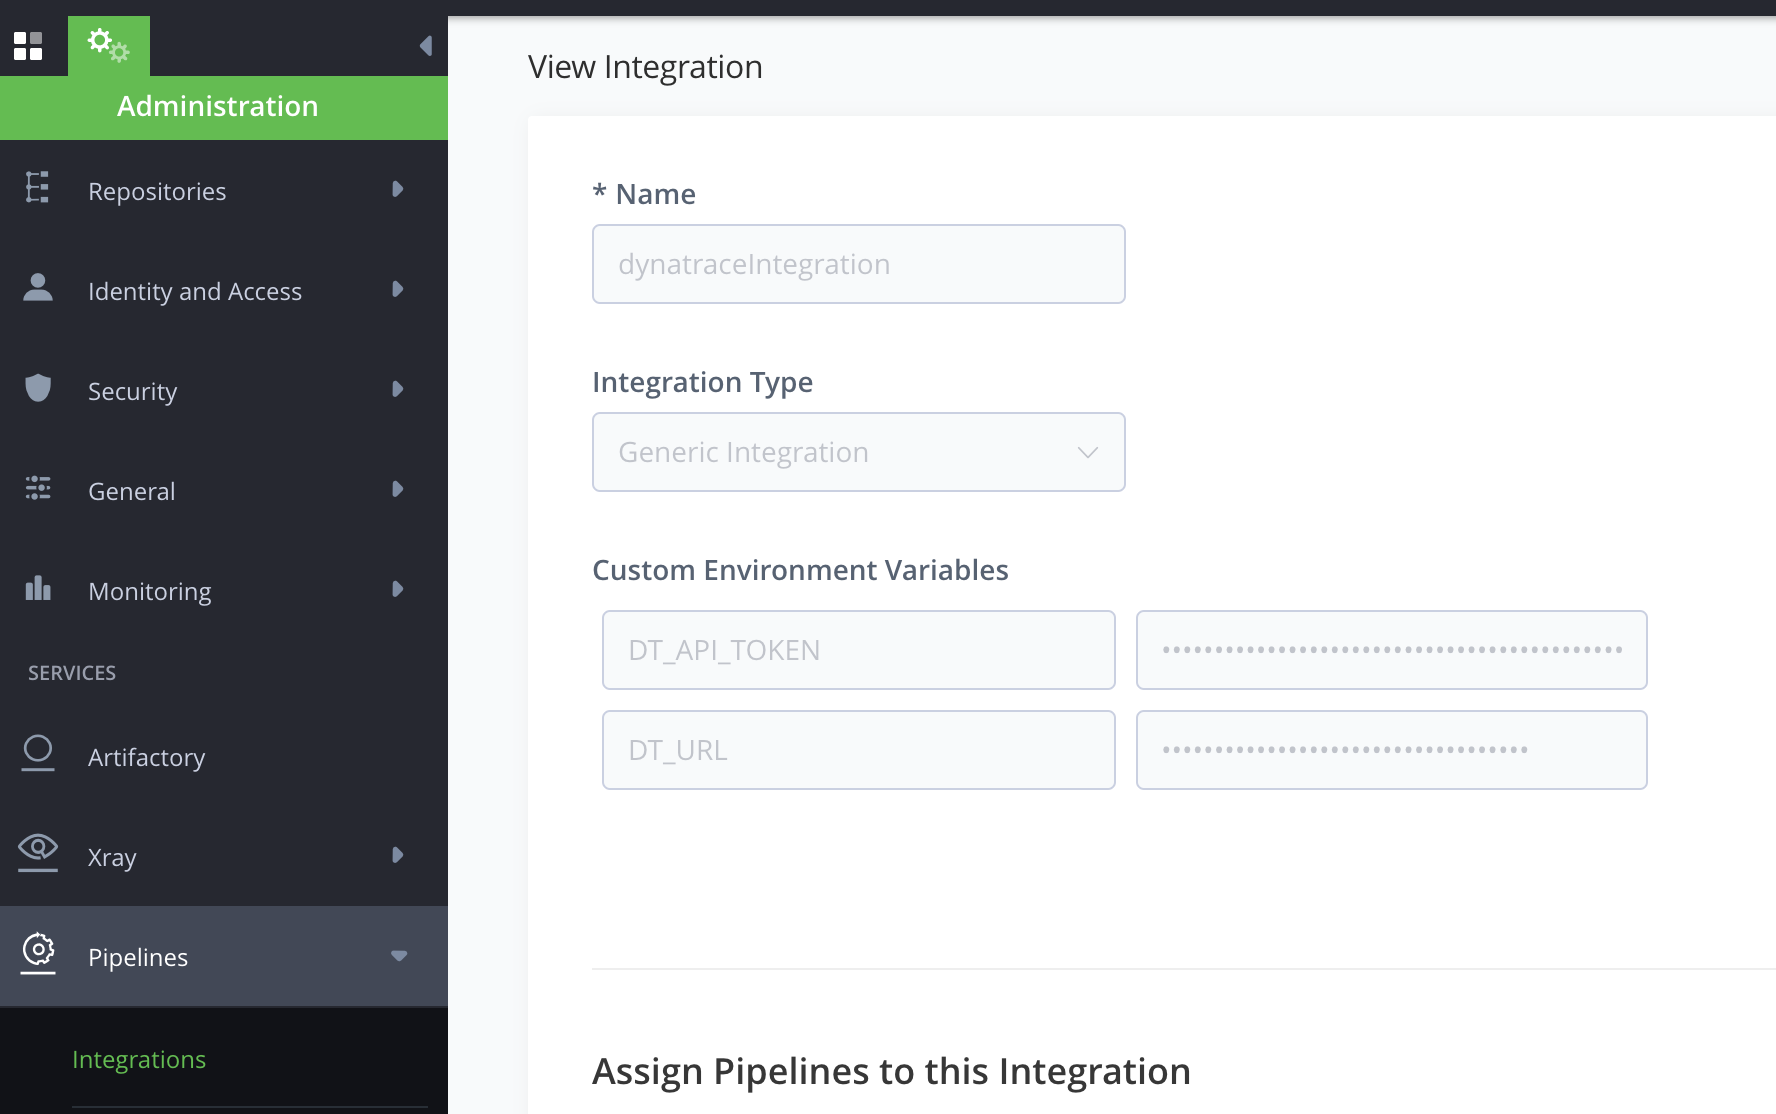
Create the Dynatrace Integration using the generic integration available within JFrog Pipelines. From the Administration page, select Integrations and then click the ‘Add Integrations’ button. On the form, fill in with these values as shown below.
-
Name = dynatraceIntegration
-
Type = pick ‘Generic Integration’ from the drop-down list
-
Add the following as the customer environment variables:
-
DT_URL- The URL of the Dynatrace instance. For example: https://abc.live.dynatrace.com
-
DT_API_TOKEN- The API token for the Dynatrace instance
-
-
-
Create the Kubernetes integration using the static
kubeconfigfile for their cloud provider generated in the previous setup section. From the Administration page, select Integrations and then click Add Integrations button. -
In the form, fill in the values as shown below.
-
Name =k8sIntegration
-
Type = Select ‘Kubernetes’ from the drop-down list
-
KubeConfig = Paste the static
kubeconfigcontents for their cloud provider generated in the previous setup section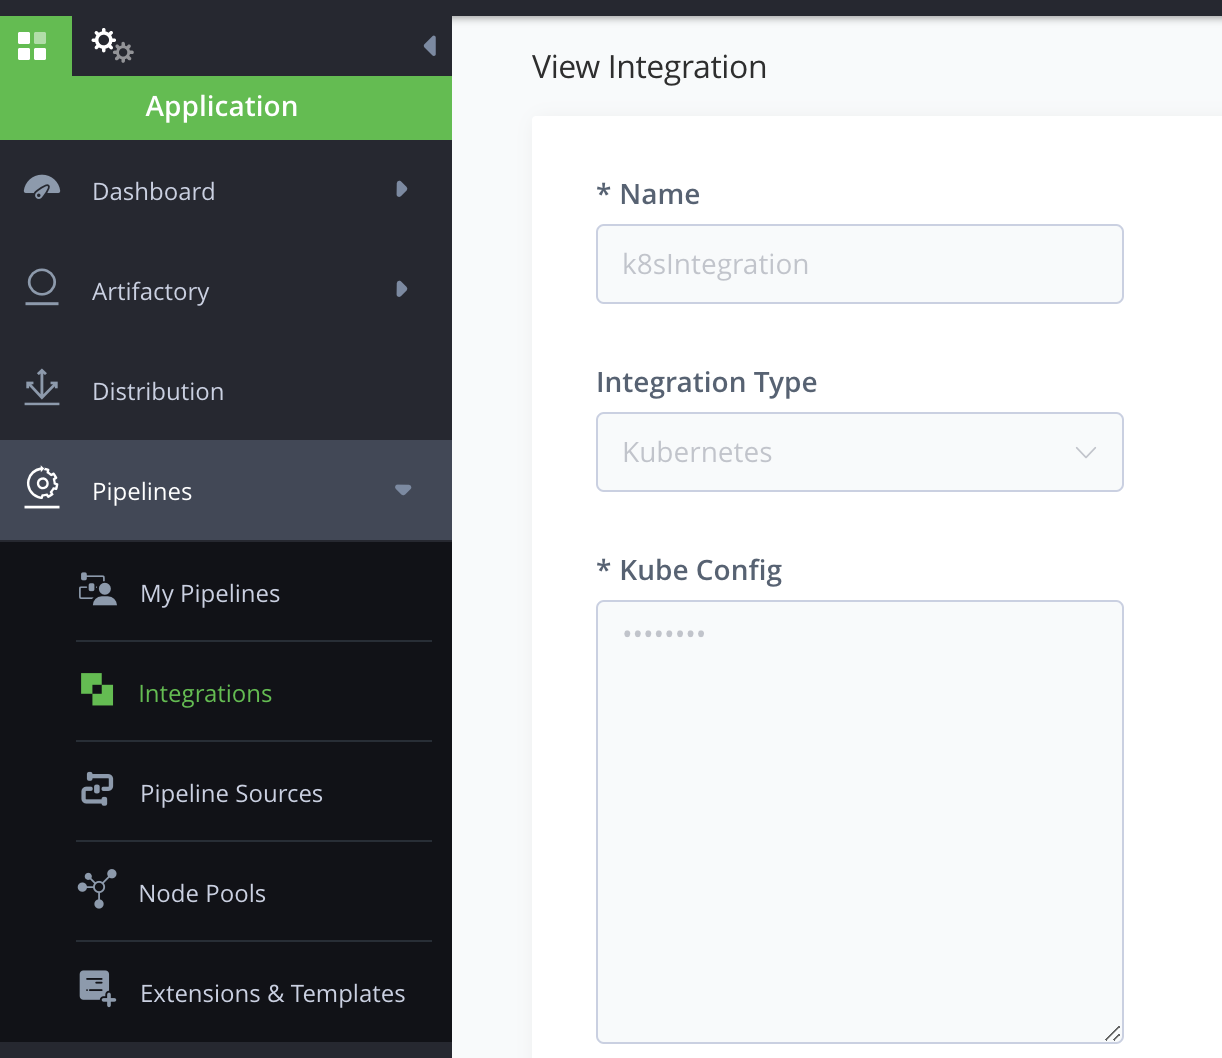
-
-
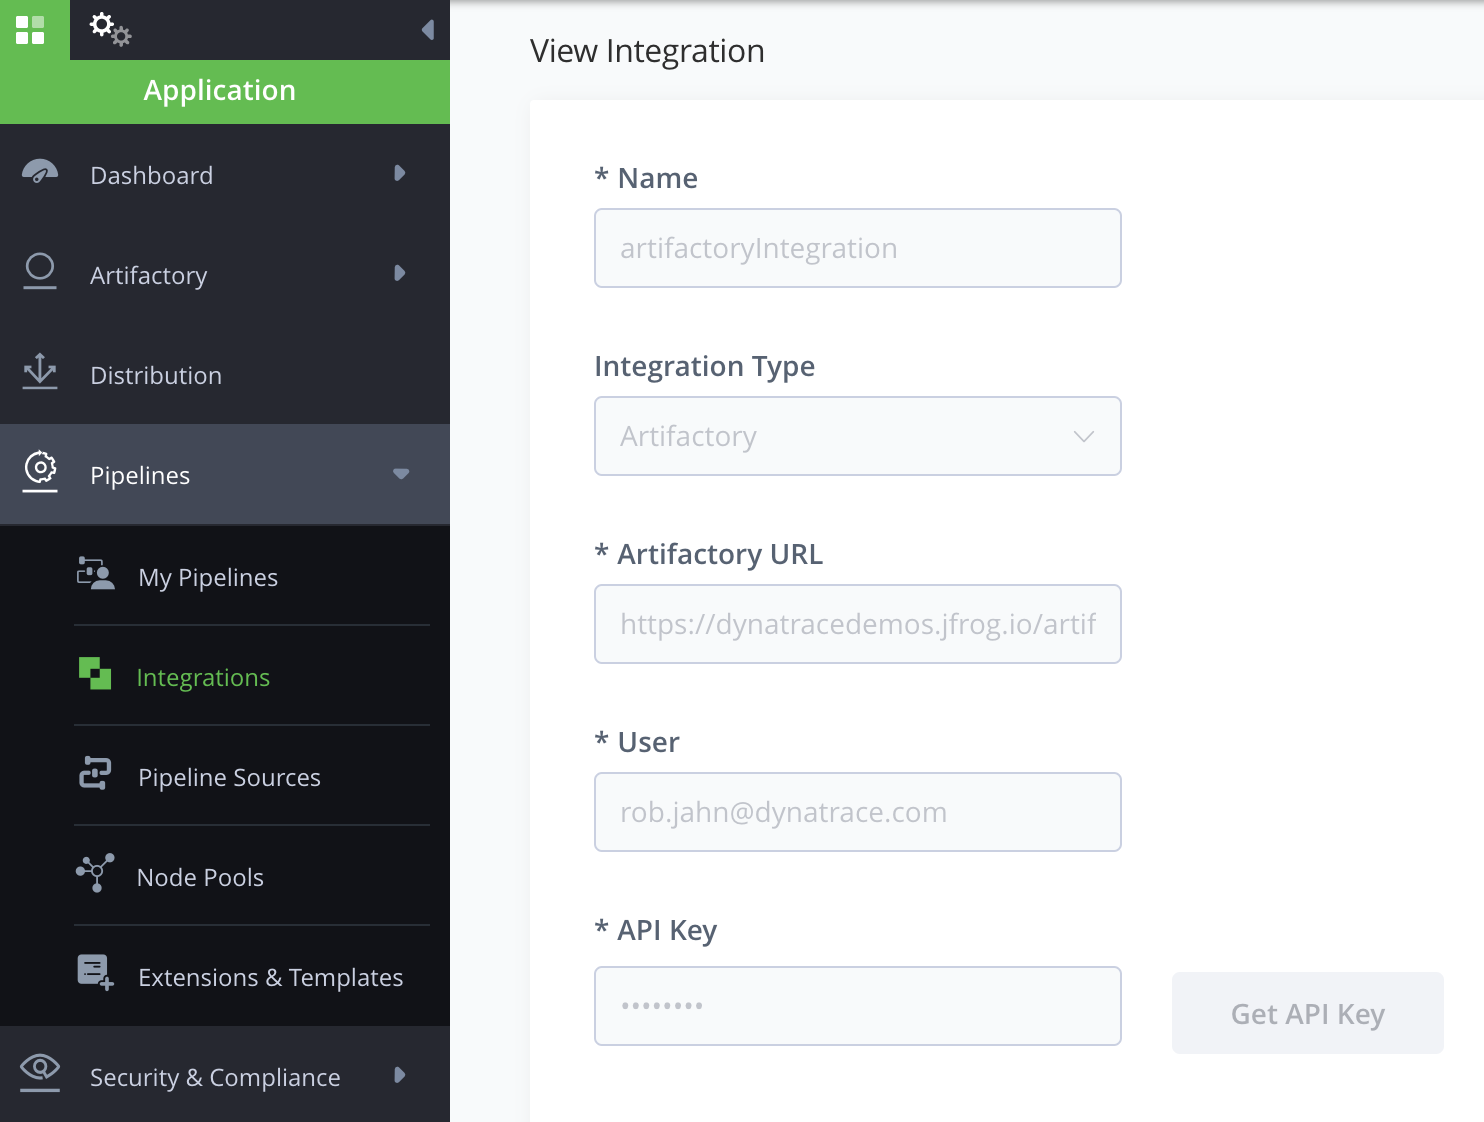
Create the Artifactory Integration. From the Administration page, select Integrations and then click Add Integrations.
-
In the form, fill in the values as shown below.
-
Name = artifactoryIntegration
-
Type = select ‘Artifactory’ from the drop-down list
-
Artifactory URL = leave as default
-
Artifactory User = leave as default
-
API Key = Click the ‘Get API Key’ button
-
The new integrations should look like this:
Set up the Pipeline for Dynatrace - Add Repositories
-
Create the Docker repository.
- From the Administration page, select Repositories and then click Add Repository.
- Select the ‘local repository’ option.
- In the popup window, select Docker.
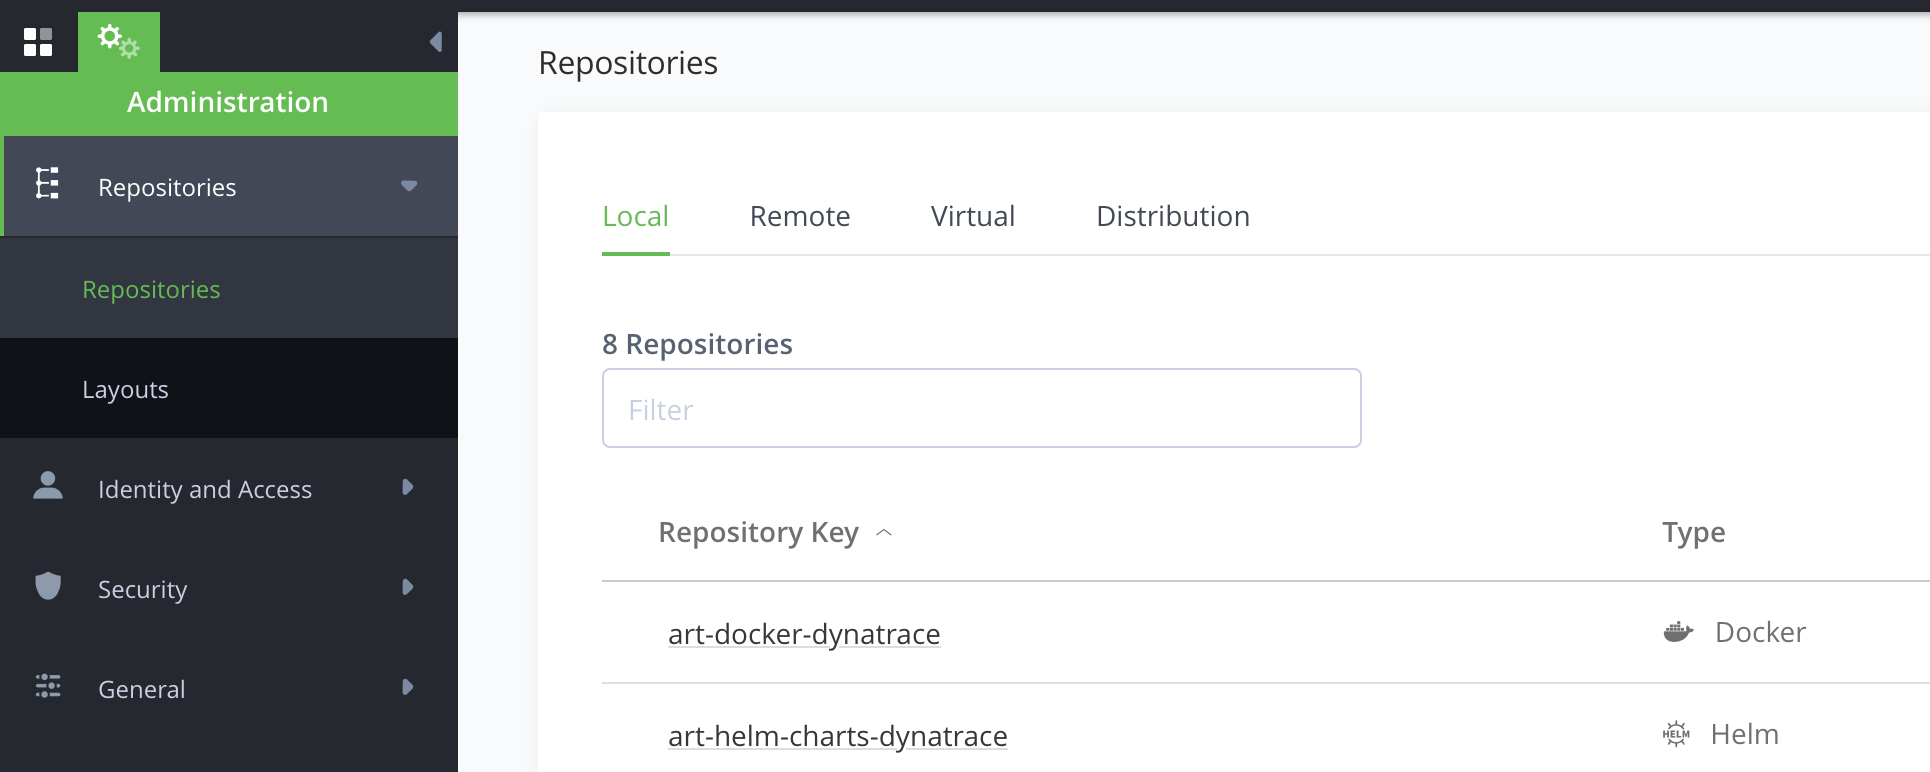
- In the form, set the ‘Repository Key’ = art-docker-dynatrace.
- Leave the other fields with the default settings.
- Click the Save and Finish.
-
Create the Helm Chart repository.
-
From the Administration page, select Repositories and then click Add Repository.
-
Select the ‘local repository’ option.
-
On the popup window, select Helm.
-
On the form, set the ‘Repository Key’ = art-helm-charts-dynatrace.
-
Leave the other fields with the default settings.
-
Click Save and Finish.
The new repositories should look like this:
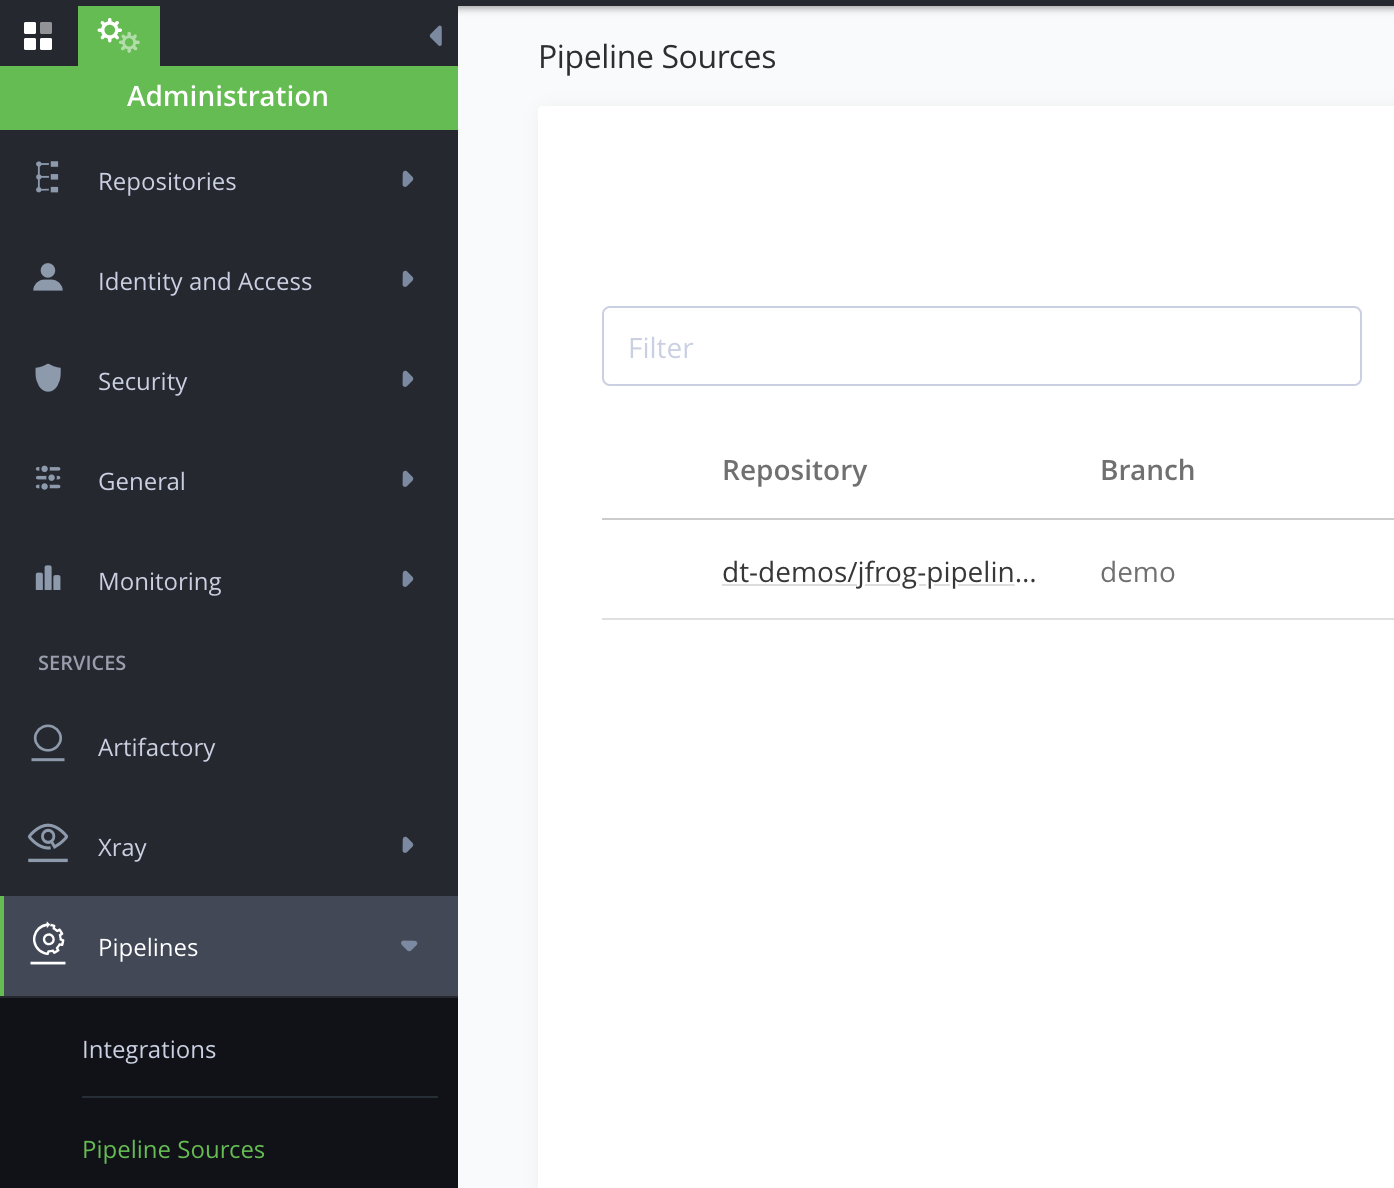
Set up the Pipeline for Dynatrace - Add a Pipeline Source
Create a new GitHub Pipeline source with your new repository using the GitHub integration created in the previous step.
-
From the Administration panel, select Pipeline Sources from the Pipelines drop-down menu.
-
Then click Add Pipeline Source and select From YAML from the drop-down menu.
-
In the form, fill in the values as shown below.
- SCM Provider Integration = githubIntegration
- Repository Full Name = From the dropdown, select the forked repository
- Branch = main
- Pipeline Config file Filter = pipelines.yml
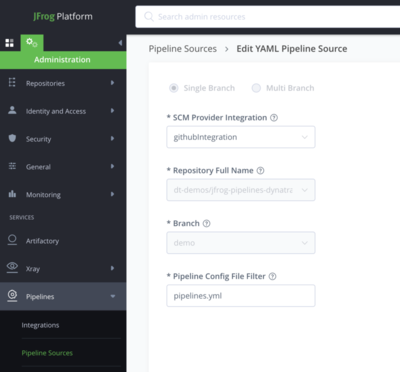
The new pipeline source should look like this.
Run the Pipeline for Dynatrace
Once the setup is complete, the pipeline can be run manually from within the JFrog console under the My Pipelines tab within the Applications panel. The pipeline will execute all the steps in a sequential manner and the completed pipeline will look like this.
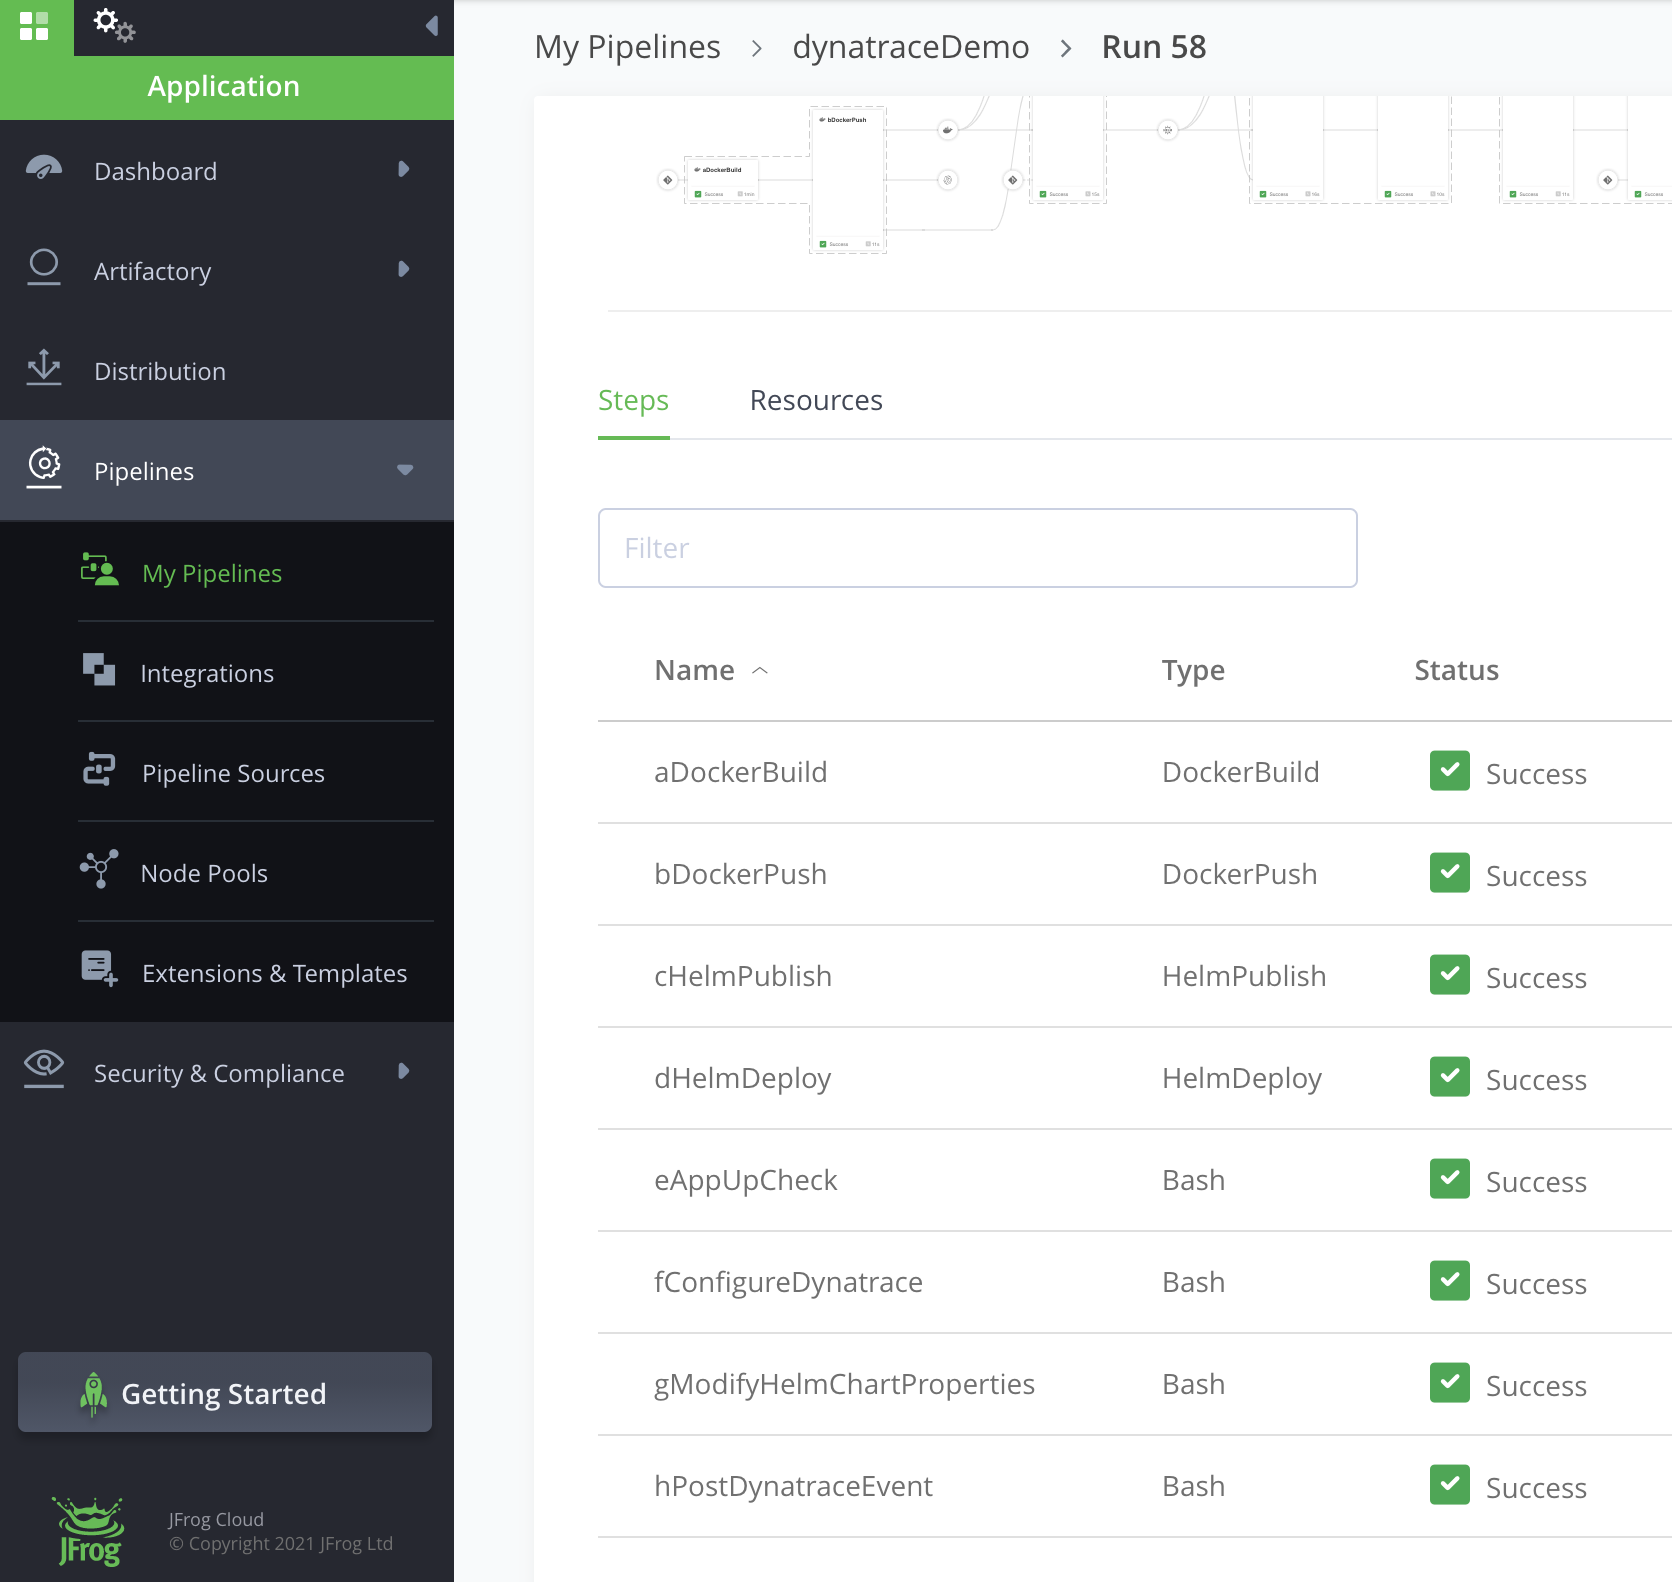
You can expand each step to review the details, but there are a number of other things you may want to review.
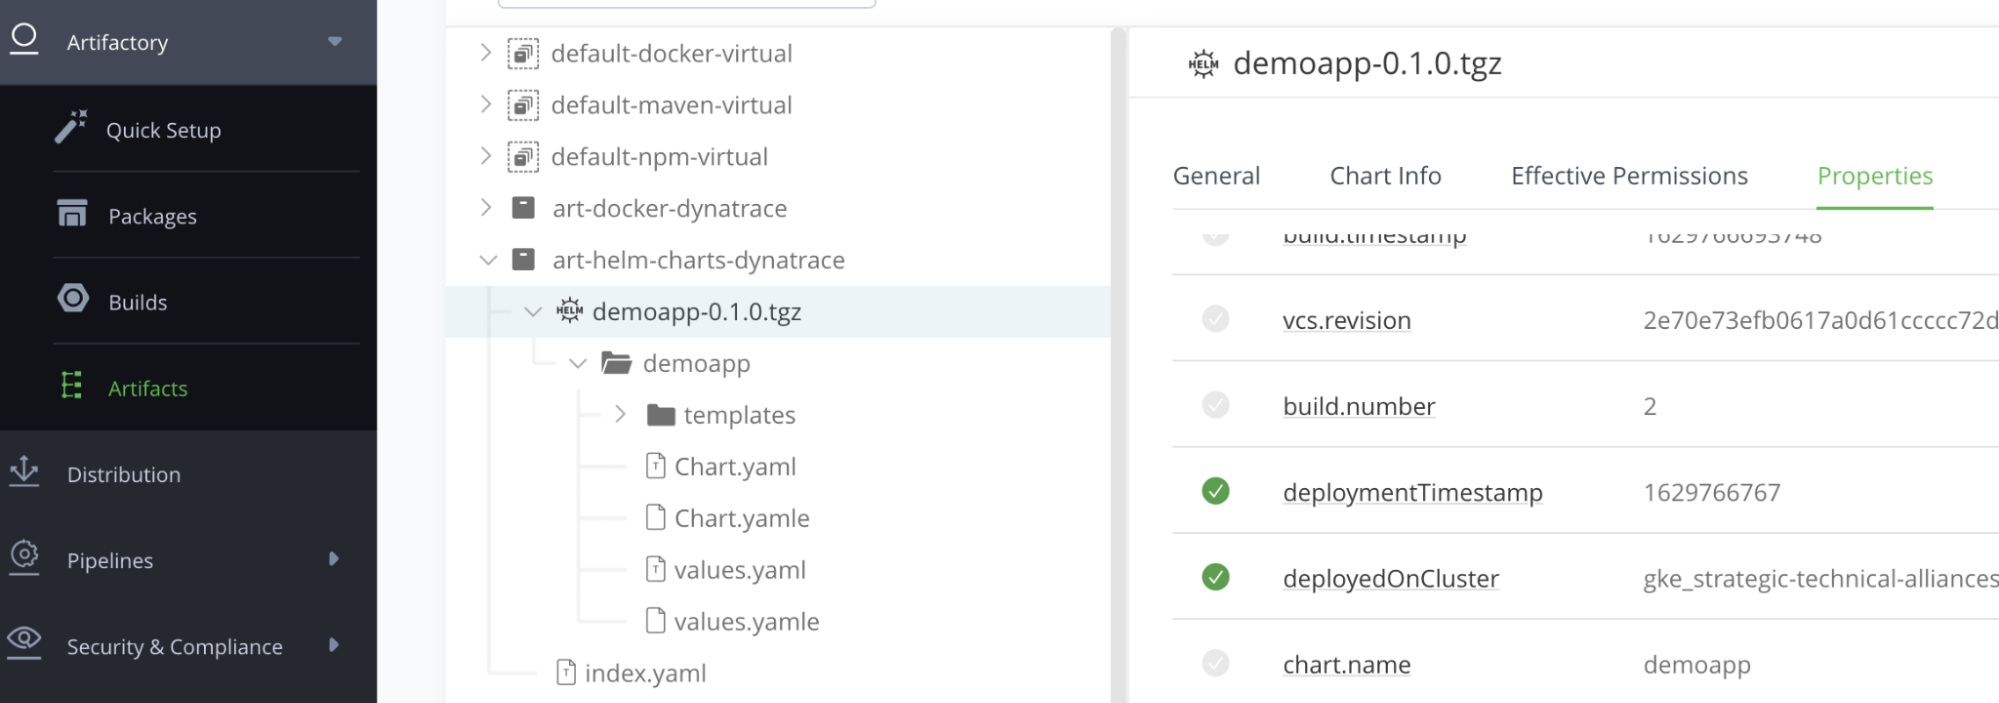
Review the Published Helm Chart
Within JFrog, expand the Artifactory repository and review the updated charts and custom properties as shown below.
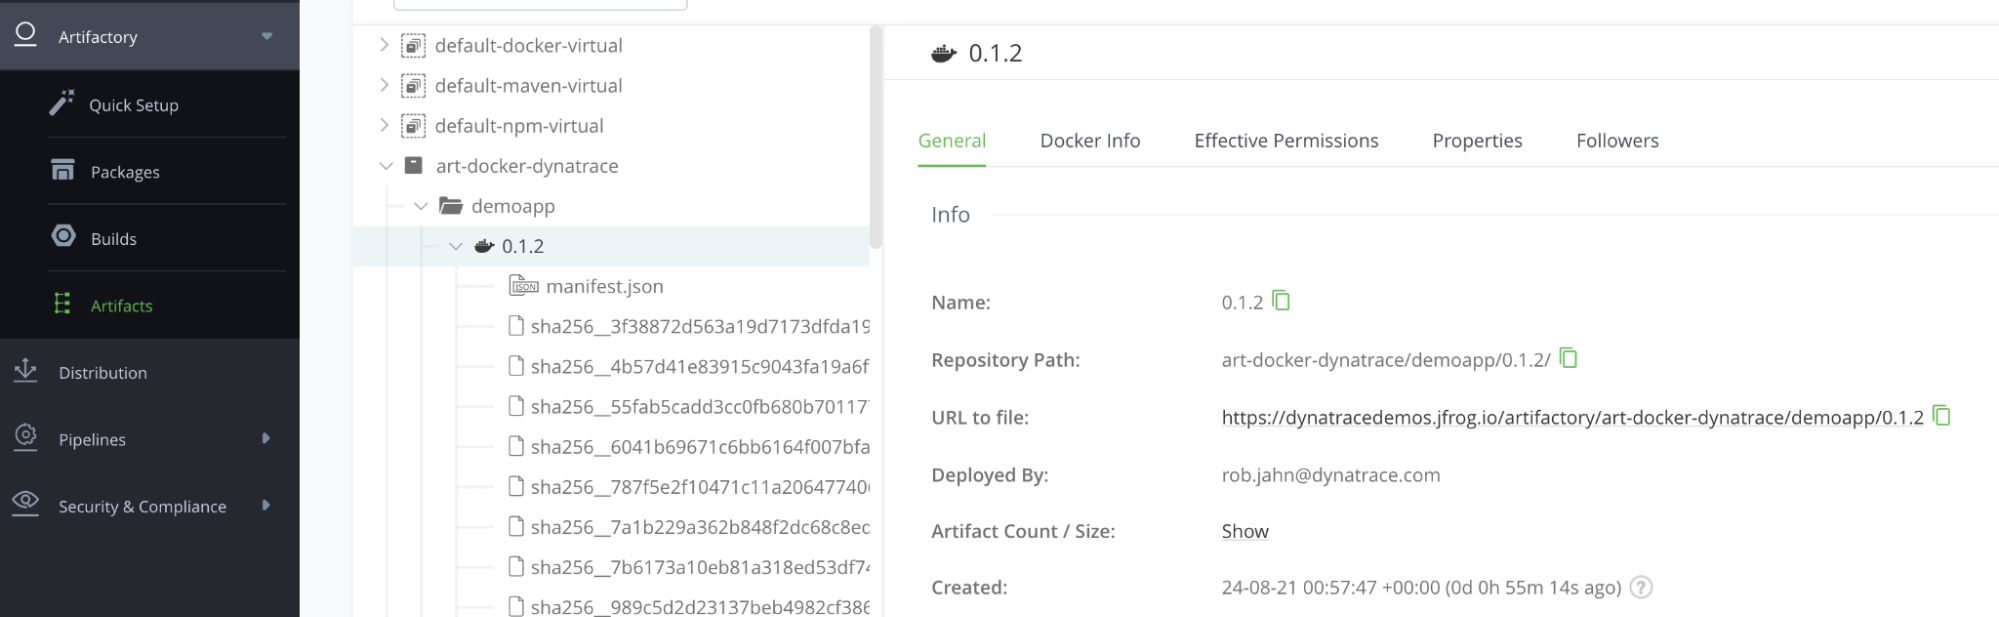
Review the Published Docker Chart
Within JFrog, expand the Artifactory repository and review the published image.
Review the Sample Application
-
First, obtain the public IP address from the Kubernetes service using this command.
kubectl -n dynatrace get service NAME TYPE CLUSTER-IP EXTERNAL-IP PORT(S) AGE demoapp LoadBalancer 10.84.2.18 34.133.103.200 8080:32602/TCP 5d -
Using the example above, open the application on port 8080 at
http://34.133.103.200:8080. The application will look like this:
Send Traffic to the Sample Application
In order for Dynatrace to fully monitor services and applications, there need to be some transactions flowing through the application. To make this process easier, a simple script is provided in the repo that will send cURL requests to the various application URLs within a loop. To run this script, open up the Google web shell and run these commands.
~/jfrog-pipelines-dynatrace-example/scripts

./sendSomeTraffic.sh
The sendSomeTraffic.sh will determine the public IP for the application and output the loop status as shown below. To stop the script, simply use ctrl-c.
Calling http://111.111.111.111:8080...

loop 1

200

200

200

200

loop 2

200

200

200

200

loop 3

200

200

...

...
Review the Dynatrace Deployment Event
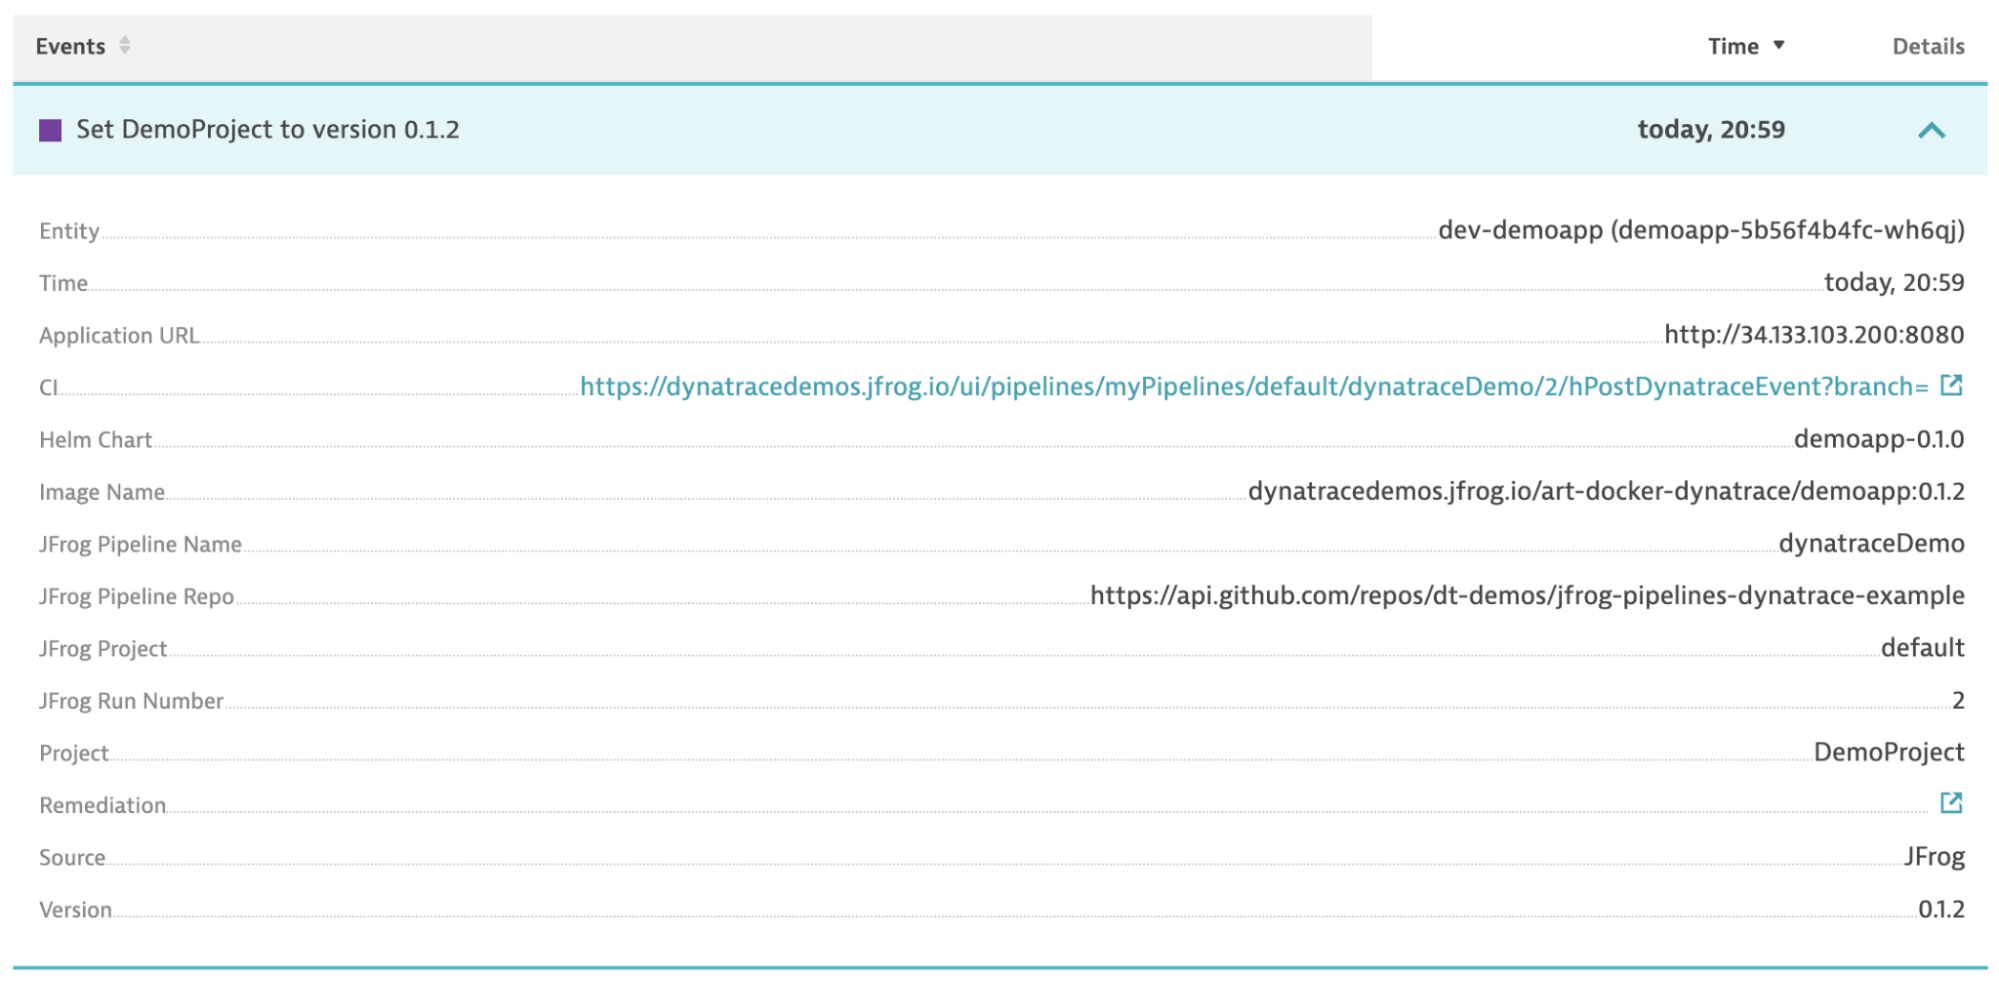
Within Dynatrace, navigate to the Releases menu to open up the release inventory dashboard. On this dashboard is the demo application, its auto-detected version and its deployment event. Below are the expanded details for an example deployment event with its associated meta-data including the URL back to the JFrog pipeline that performed the deployment.
Review the Dynatrace Kubernetes Dashboard
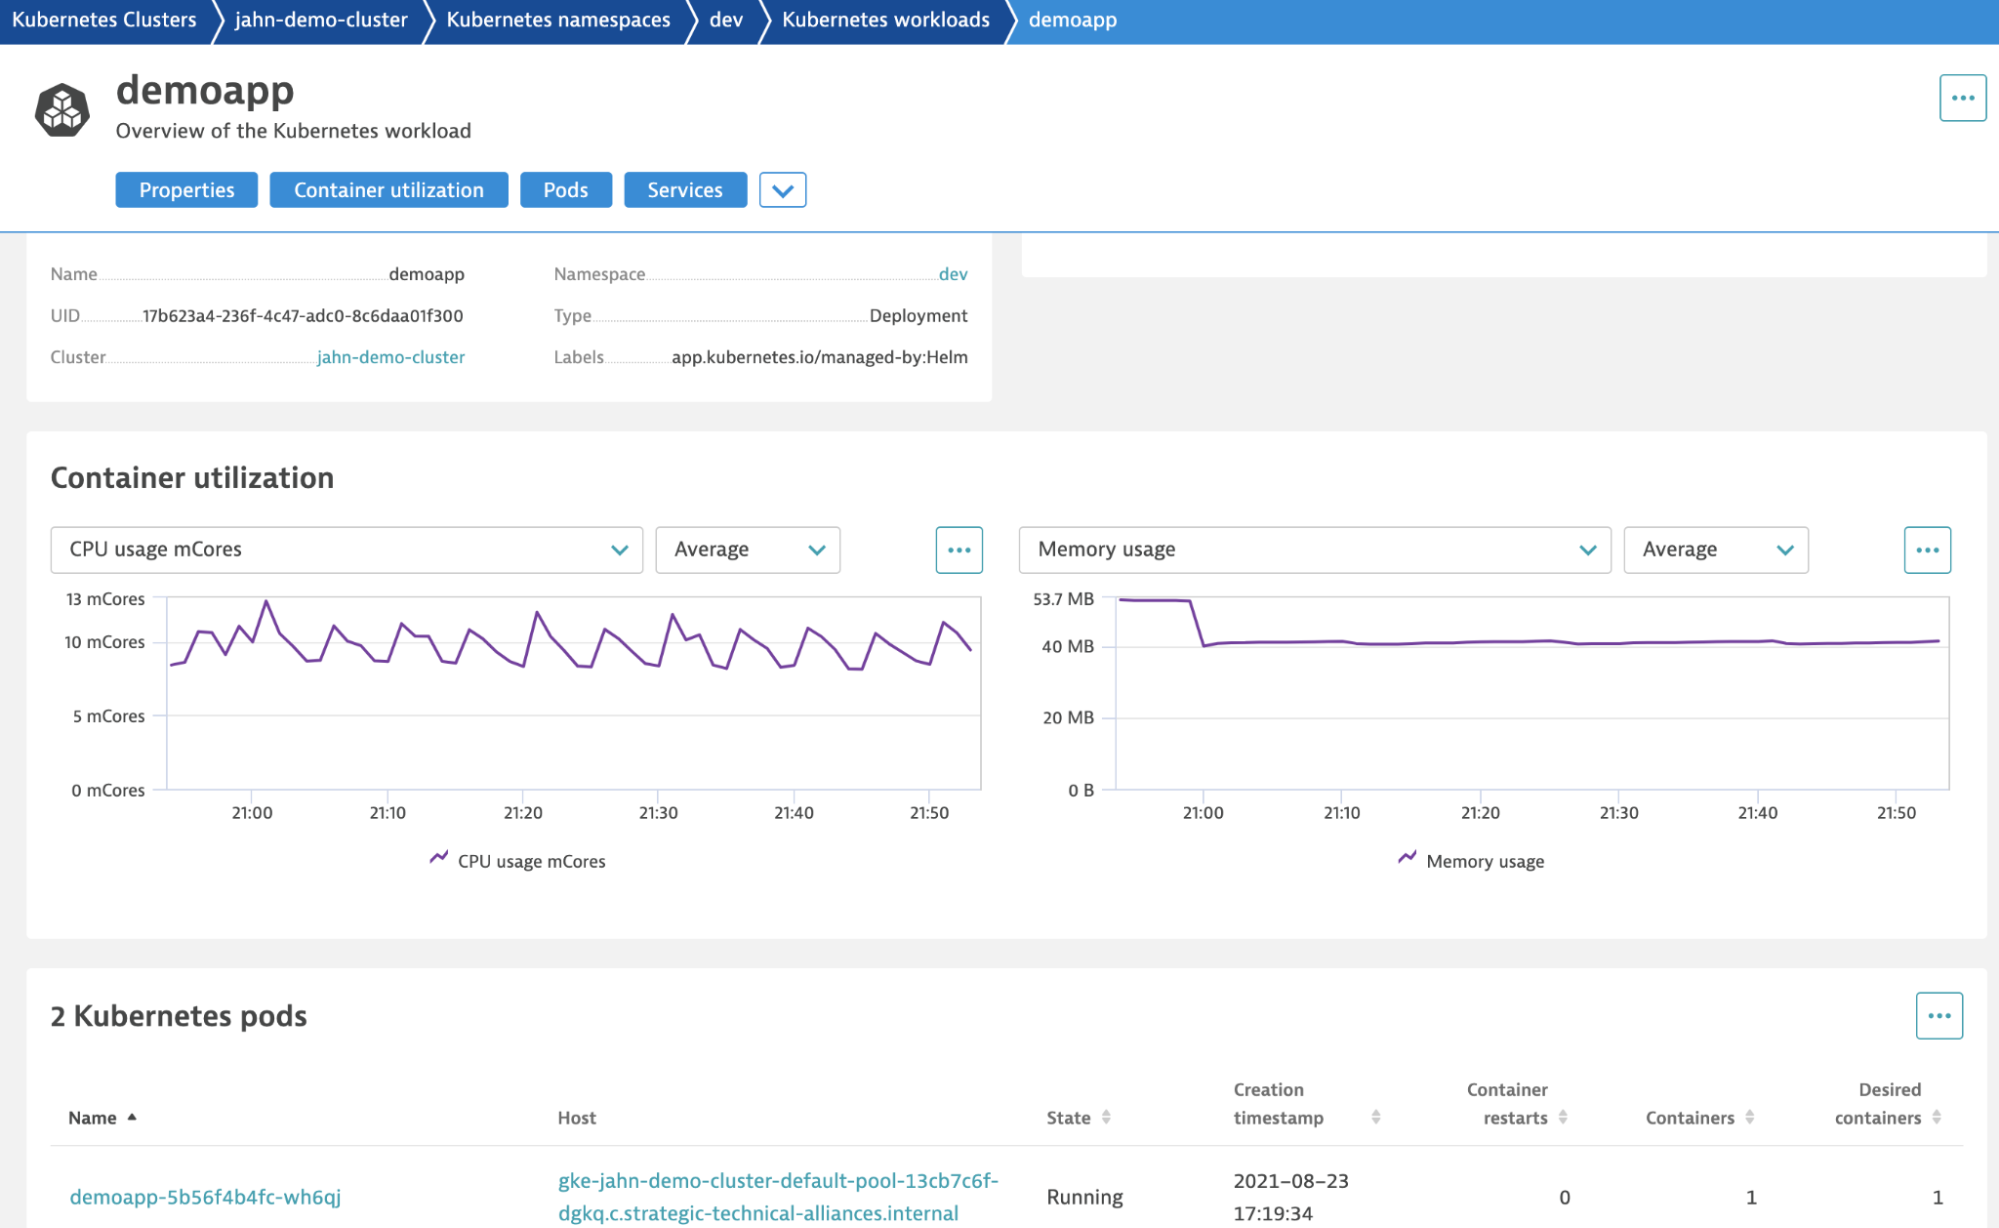
Within Dynatrace, navigate to the Kubernetes menu and drill into the workload for the demo application. As shown below, the demoapp workload dashboard shows overall utilization metrics with links to drill into the specific process.
Review the Service in Dynatrace
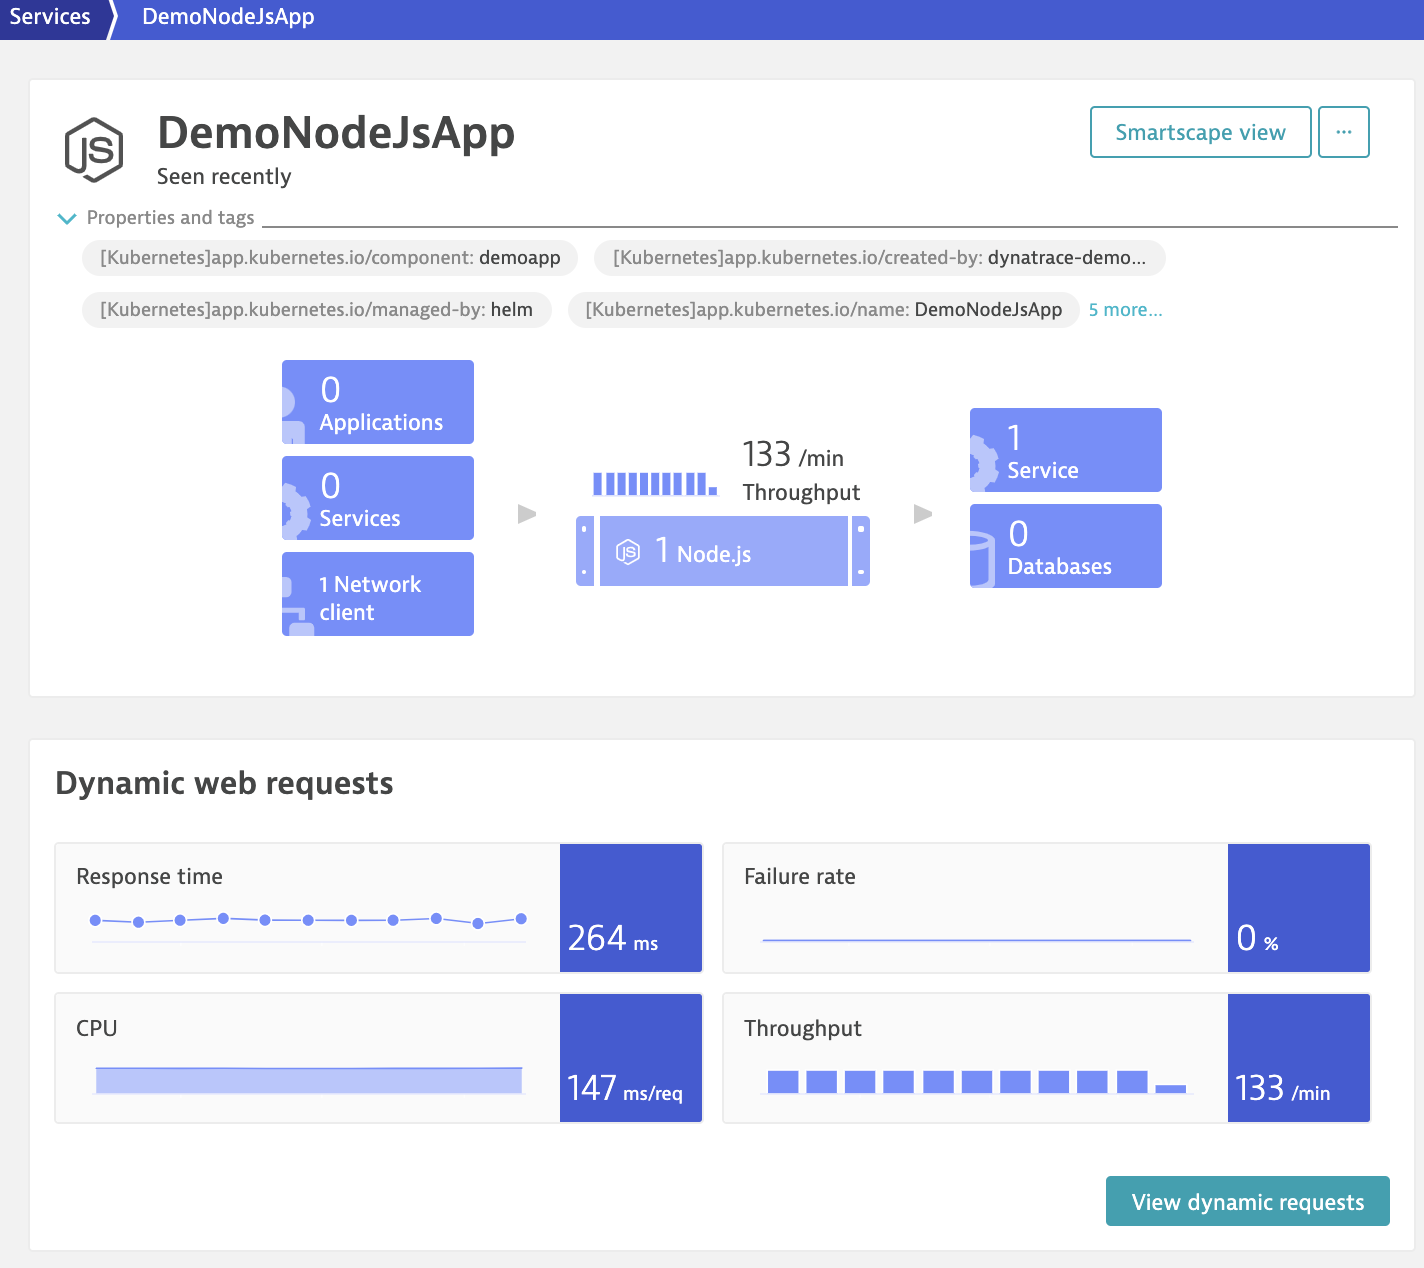
Within Dynatrace, navigate to the Services menu and open up the DemoNodeJsApp as shown below. This dashboard shows everything you need to know about the service including the time series metrics for the requests coming from the sendSomeTraffic.sh script.
Deploy Another Version of the Demo Application
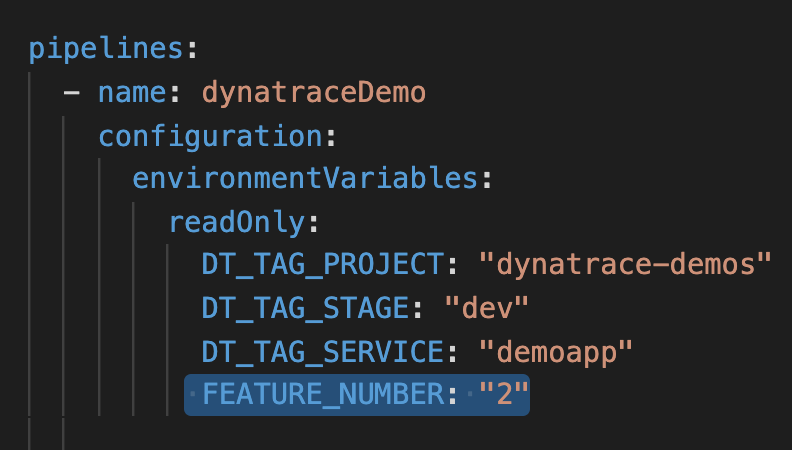
The sample app comes with built-in "feature" behaviors - meaning - if you launch the app and tell it to run as feature 1, 2, or 3 to show slightly different behavior. A feature is set using a Docker build argument that sets an environment variable that the application code looks for. You can read more about this in the demoapp README file.
To change feature numbers, adjust the environment variable FEATURE_NUMBER to the value in the pipeline.yml file and commit the code change. JFrog will automatically re-run the pipeline after any code commit, so just monitor the progress of the pipeline and then go back to review the Dynatrace release inventory, events, and JFrog artifacts. Below is an example of what the change should look like:
Preparing the Kubernetes Cluster and Dynatrace
This section lists the steps needed to prepare the Cluster and Dynatrace when integrating Dynatrace into a Pipeline. Preparing the Kubernetes cluster for Dynatrace includes the following:
| Task | Description | For more information, see... | |
|---|---|---|---|
| 1 | Create and Connect to the Cluster | Prepare containerized application and uses Helm to create and connect to the cluster. | Create and Connect to Cluster |
| 2 | Create a JFrog Service Account | Create the service account needed for the Kubernetes pipeline integration. | Create a JFrog Service Account |
| 3 | Create a Dynatrace Viewer | Create the Kubernetes role needed by Dynatrace to call the Kubernetes API. | Create a Dynatrace Viewer Role |
| 4 | Create a JFrog Docker Credentials Secret | Create the credentials as a Kubernetes secret needed by Helm for deployment. | Create a JFrog Docker Credentials Secret |
| 5 | Install the Dynatrace Operator | Setup the Dynatrace operator handle the Dynatrace OneAgent Kubernetes API monitoring. | Install Dynatrace Operator |
| 6 | Verify the Cluster within Dynatrace | Log into Dynatrace and review the required pages to verify monitoring. | Verify the Cluster within Dynatrace |
| 7 | Create an API Token | Create an API Token for the Dynatrace integration. | Create an API Token for Dynatrace |
Create and Connect to Cluster
A Kubernetes cluster is not required for the integration; instead, the reference pipeline uses a containerized application and uses Helm for deployments.
This demo uses Google GKE using the default settings from the Google console.
- cluster-version 1.20.8
- 3 nodes (12GB 6 CPU) machine-type "e2-medium"
Once the cluster is provisioned, use the google console web console to run these commands to configure kubectl to connect and view the cluster nodes.
gcloud container clusters get-credentials <CLUSTER NAME> --zone <ZONE> --project <PROJECT>

kubectl get nodes
Create a JFrog Service Account
This step creates the service account that is needed in the next section as part of the k8s pipeline integration setup.
-
From the cloud shell clone the demo repository. For example:
git clone https://github.com/dt-demos/JFrog-pipelines-dynatrace-example.git -
Navigate into the setup folder.
cd JFrog-pipelines-dynatrace-example/setup -
Run this script that creates the k8s service account, adds the namespace for where the sample application will be deployed, and generates a kubeconfig file for a GKE cluster.
./createKubernetesServiceAccounts.sh -
Copy the contents from the kubeconfig file to a safe location.
Create a Dynatrace Viewer Role
This step creates the Kubernetes role that is needed by Dynatrace to call the Kubernetes API.
-
Assuming you are still in the “
JFrog-pipelines-dynatrace-example/setup” folder within the Google cloud shell, run this command to add the role.kubectl create -f dynatrace-oneagent-metadata-viewer.yaml -
You can verify that the “dynatrace-oneagent-metadata-viewer” was created using this command.
kubectl -n dev get role
See the Dynatrace Documentation for more details and the ways this role can be configured.
Create a JFrog Docker Credentials Secret
This step creates the Frog Docker repository credentials as a Kubernetes secret. This secret is needed by Helm as it pulls the docker image during Helm deployments.
-
From the Google cloud shell, run this command to log in to your Artifactory Docker repository.
docker login YOUR-ACCOUNT.JFrog.io -
To export the saved credentials into a Kubernetes secret, run this command.
kubectl create secret docker-registry regcred \

  --docker-server=<YOUR-ACCOUNT.JFrog.io> \

  --docker-username=<username> \

  --docker-password=<Artifactory_API_key> \

  --docker-email=<email>
See the Kubernetes Documentation for more details.
Install Dynatrace Operator
One key Dynatrace advantage is the ease of activation and for Kubernetes the Dynatrace Operator is designed specifically to handle the lifecycle of the Dynatrace OneAgent, Kubernetes API monitoring, OneAgent traffic routing, and all future containerized componentry such as the forthcoming extension framework.
Operator setup is typically a one-time activity as part of the Kubernetes cluster and the quickest way to deploy the Dynatrace operator is the deployment wizard within the Dynatrace UI.
-
Log in to Dynatrace
-
In the Dynatrace menu, select Manage.
-
Go toDeploy Dynatrace | Start Installation | Kubernetes
-
On the Kubernetes page fill in the following.
- Name = same as your cluster name. This name is used by various Dynatrace settings, including Kubernetes cluster name, Network Zone, ActiveGate Group, and Host Group
- Choose ‘Create Token’
- Depending on your setup, choose ‘Skip SSL’
-
Depending on your setup, ‘Enable volume storage’
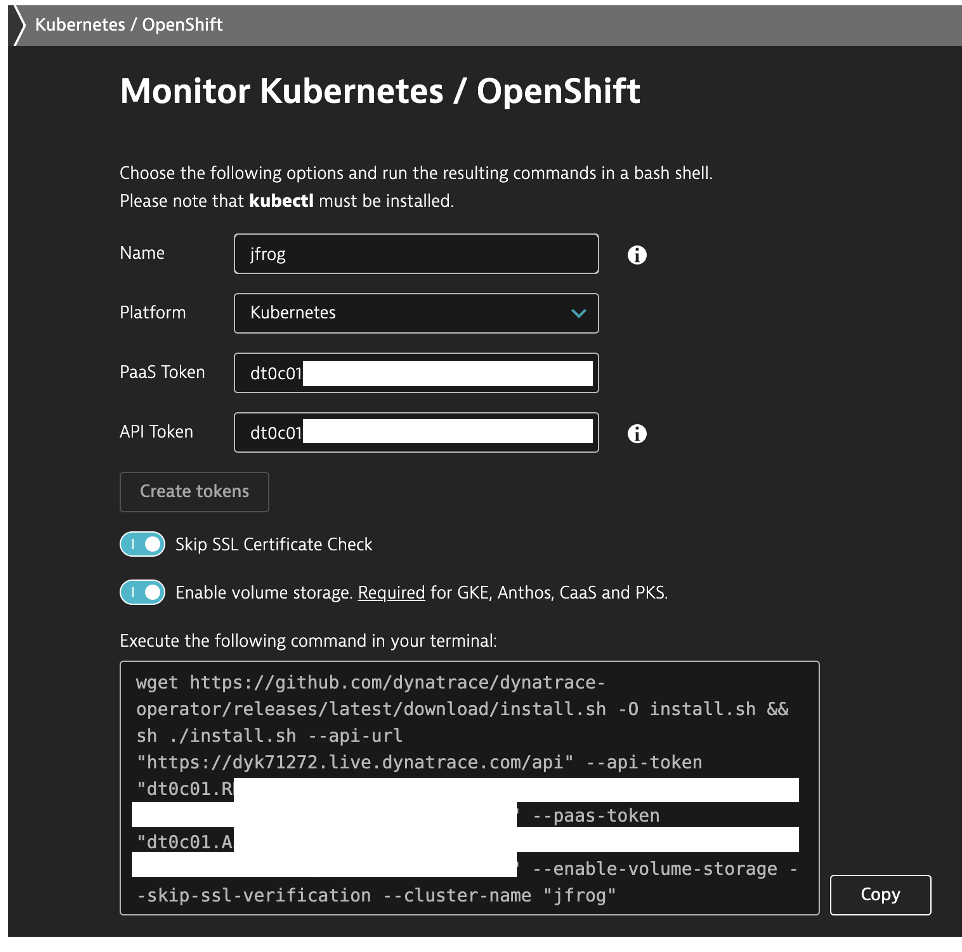
-
Use the Copy function to copy and paste the generated command from the Dynatrace wizard in the Google cloud shell and run it.
-
After processing, you can run this command from the Google cloud web shell. You want to see that all pods are running as shown below before moving to the next section.
kubectl -n dynatrace get pods

NAME                                 READY   STATUS    RESTARTS   AGE

dynakube-classic-gkt9f               1/1     Running   0          4d3h

dynakube-classic-rnndv               1/1     Running   0          4d3h

dynakube-classic-s7v4l               1/1     Running   0          4d3h

dynakube-kubemon-0                   1/1     Running   0          4d3h

dynakube-routing-0                   1/1     Running   0          4d3h

dynatrace-operator-8b89765d5-znzd6   1/1     Running   10         5d3
Verify the Cluster within Dynatrace
Log in to Dynatrace and review each of these pages to verify that the Kubernetes cluster is being monitored.
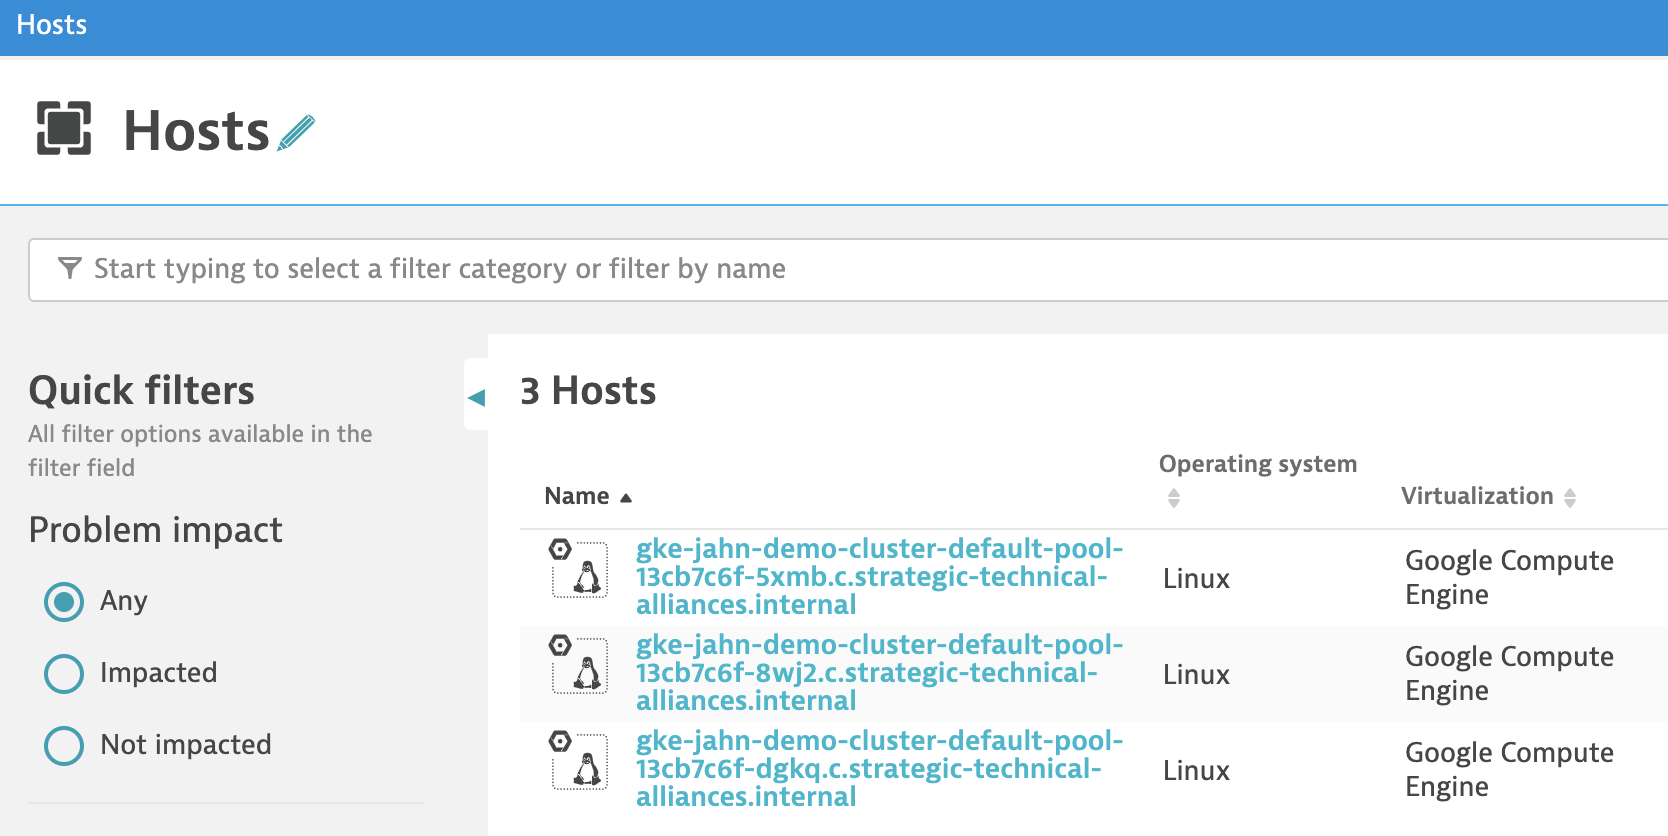
-
In the Dynatrace menu, select Hosts. You should see several hosts as shown below:
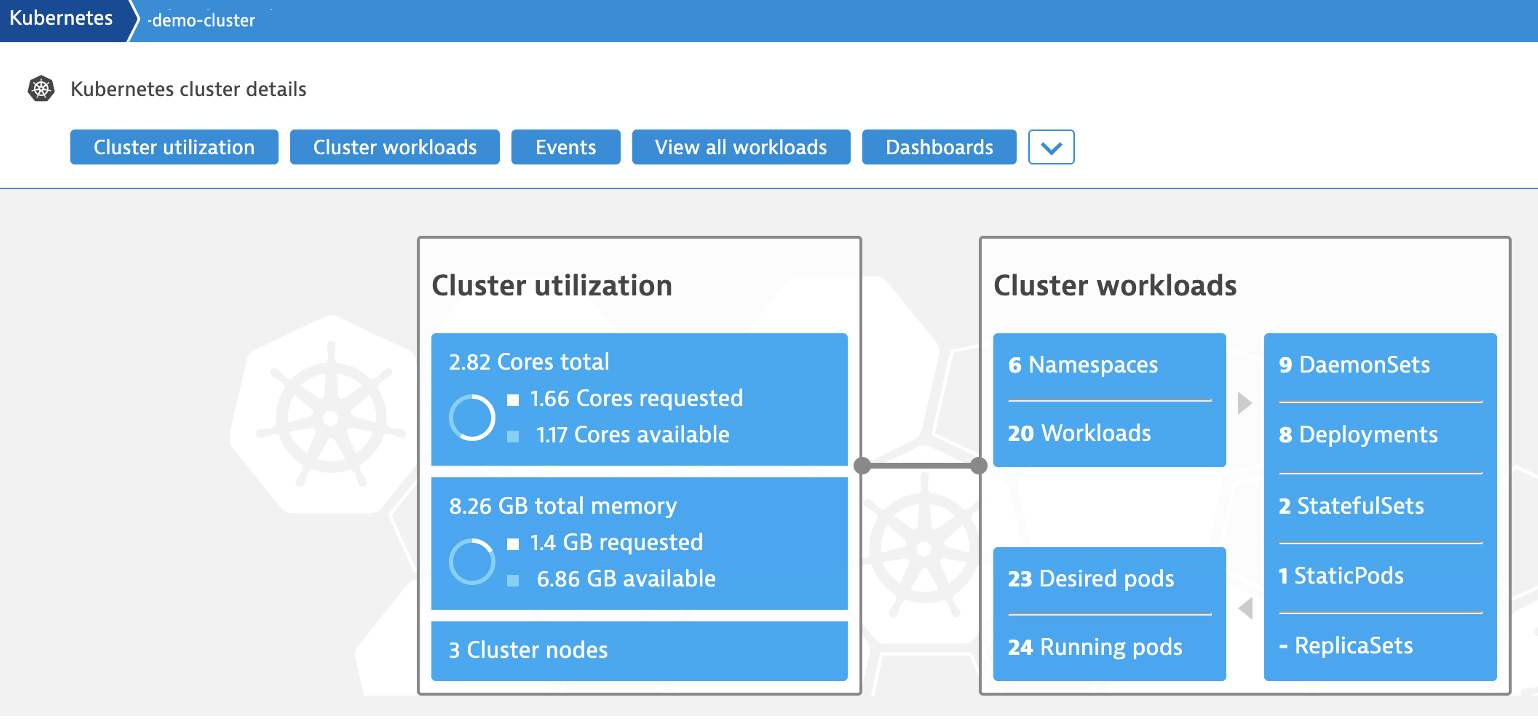
-
In the Dynatrace menu, select Kubernetes. You should see the cluster as shown below:
Create an API Token for Dynatrace
Within Dynatrace, create an API Token.
-
Log in to Dynatrace.
-
In the Dynatrace menu, select Settings.
-
Go to Integration | Dynatrace API.
-
Select Generate token.
-
Enter a name for your token such as JFrog.
-
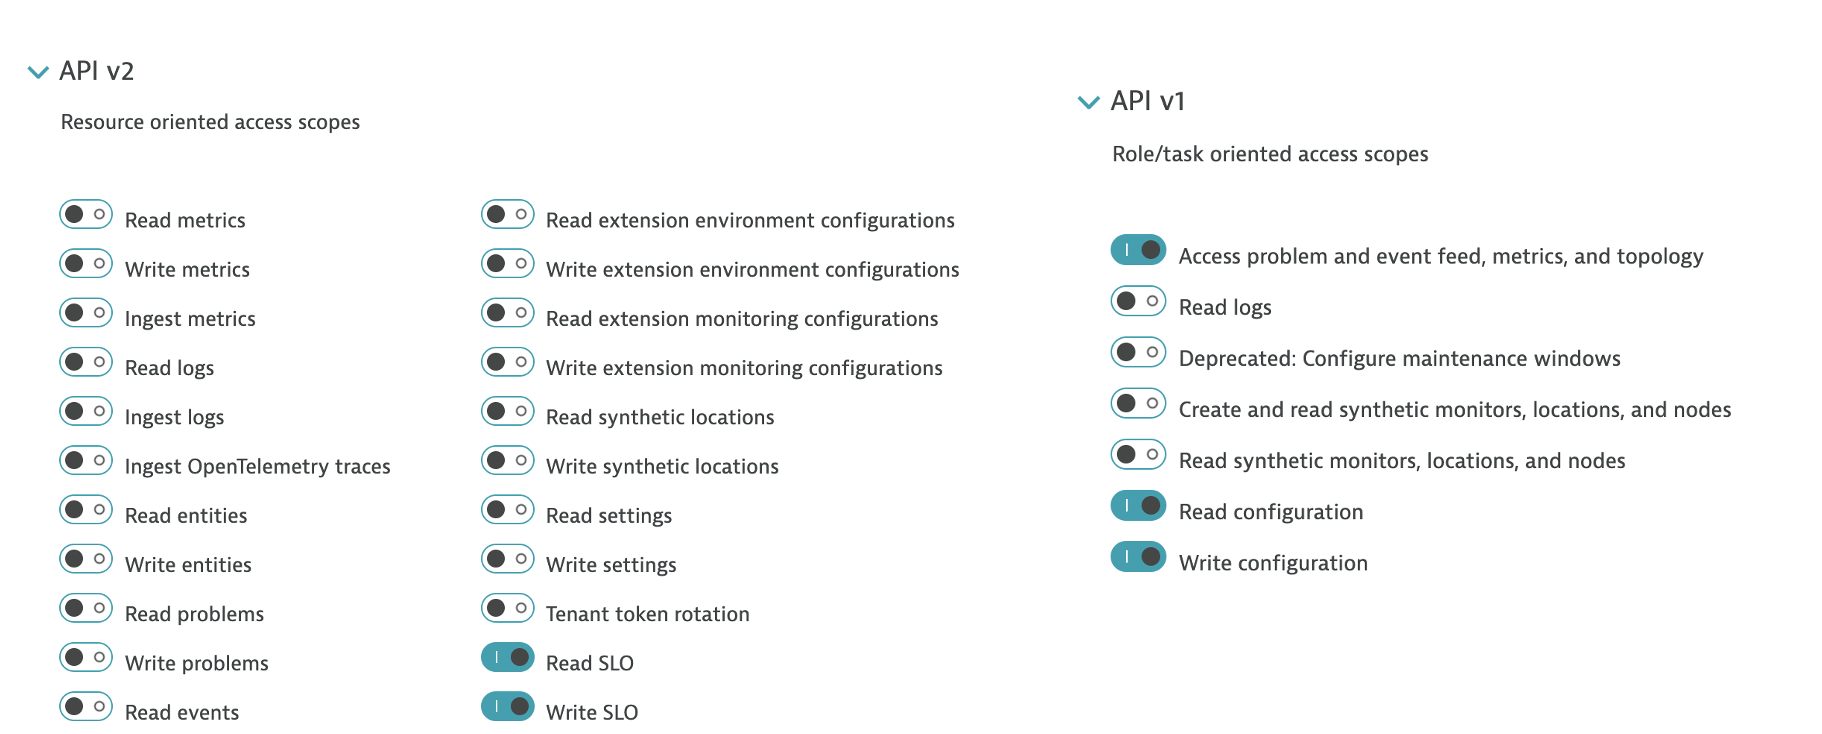
Select the required permissions for the token as shown below.
-
Click the Generate button.
-
Copy the generated token to a safe location. This token is required for the next section of the Dynatrace pipeline integration setup.
Updated 16 days ago