Inference Analytics
The model Analytics tab provides an interface to the JFrog ML Lake, which is an automated log collection system for models.
In addition to performance data, you can also find all the predictions that were made with models deployed via JFrog ML, including the input and output data of each function of your models.
The data is stored as parquet files in your object storage, and you can also load it into your favorite BI tool and analyze the model data with your tools.
JFrog ML Lake Analytics
Enabling JFrog ML Analytics Collection: JFrog ML Analytics collection is enabled by default when using the api decorator.
@frogml.api()
def predict(self, df):
    return pd.DataFrame(self.catboost.predict(df[self.columns]), columns=['churn'])
Disabling JFrog ML Lake Analytics: It can be turned off by passing analytics=False to the decorator.
@frogml.api(analytics=False)
def predict(self, df):
return pd.DataFrame(self.catboost.predict(df[self.columns]), columns=['churn'])Notes
Analytics columns are defined based on the naming conventions of input variables within the
predict()method. When utilizing the defaultdfparameters, these columns commence withinput_. Conversely, if you've specified custom parameters, the columns will initiate with the name of your parameter.For instance, if your predict signature reads as follows:
def predict(self, request) -> String, then your analytics input columns will begin withrequest_.To re-enable the ML lake analytics after disabling, rerun the
api decoratoras described above.
▶ To configure columns to be excluded from analytics, configure the decorator with the column names:
@frogml.api(analytics_exclude_columns=['col_1', 'col_2'])Query Analytics in the UI
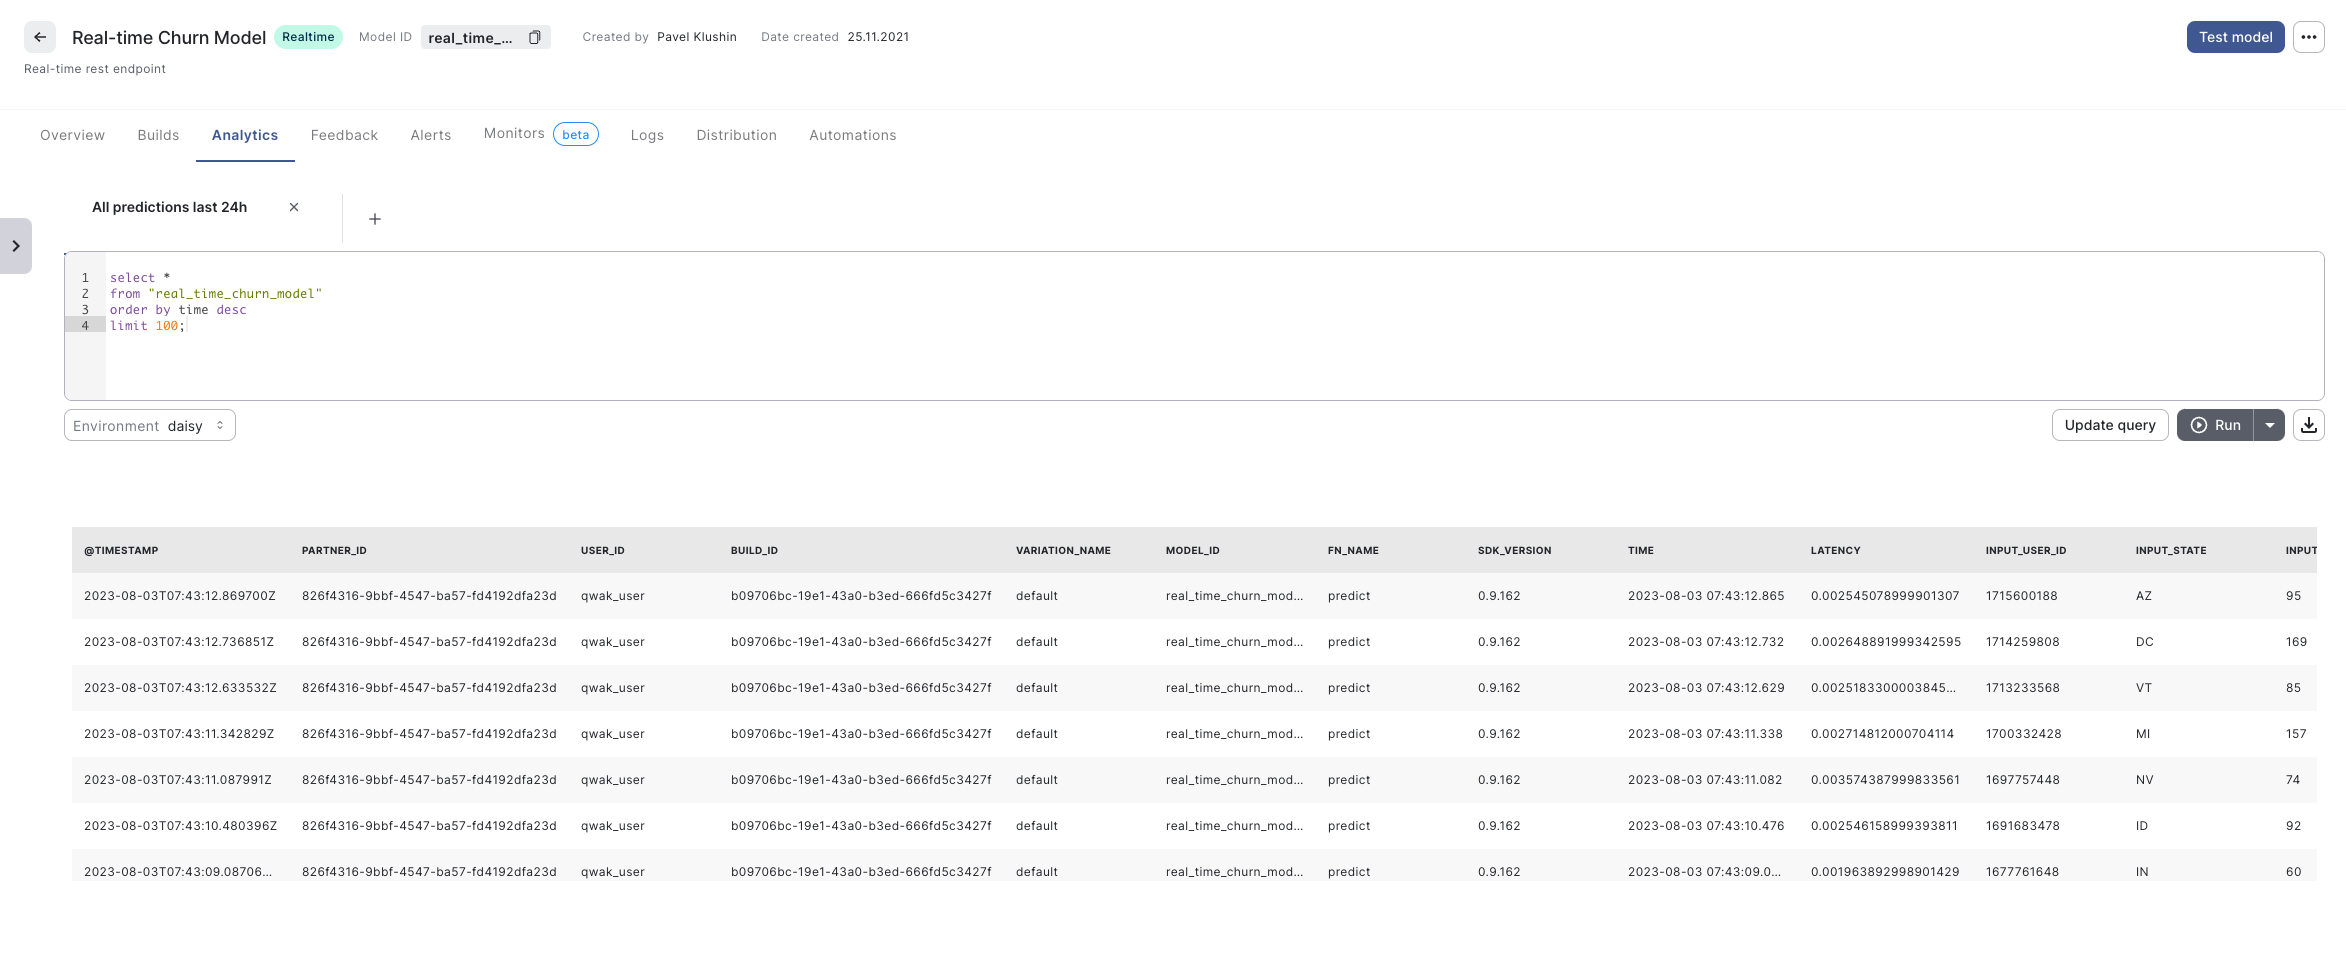
To analyze the model requests and predictions, write SQL queries In the Analytics view.
Important - Leveraging Partitions in Queries
Model Inference data is partitioned daily according to the
datecolumn. To improve query performance and avoid scanning through all the data, which can be significantly slower (and costlier), leverage this partitioning scheme in your analytics queries.
Retrieve Analytics Programmatically
To retrieve data from JFrog ML Analytics Engine into a Pandas Dataframe use the run_analytics_query function of the FrogMLClient:
from frogML import FrogMlClient

client = FrogMlClient()
df = client.run_analytics_query("select * from your_table")
When you call the code as shown below, the function will wait until the result is ready (or until the query fails for whatever reason).
However, you can also control how long you want to wait for the result by passing the timeout parameter to the run_analytics_query function. If the JFrog ML Analytics Engine won't return a response within a given time window, the client will raise a TimeoutError.
from datetime import timedelta
from frogml import FrogMlClient

client = FrogMlClient()
df = client.run_analytics_query("select * from your_table", timeout=timedelta(seconds=123))
Logging Custom Values
A model's predict function can log custom data during the inference request. To use the custom data logger, we need to add the analytics_logger parameter to the predict function.
Important: The parameter MUST be called analytics_logger!
@frogml.api(analytics=True)
def predict(self, df, analytics_logger):
    ...
The feature works only when the analytics feature of the JFrog ML API is enabled (it's enabled by default, or we can explicitly specify the analytics=True parameter).
Now, in the predict function, we can log any scalar value, lists, dictionaries, Pandas DataFrame, and any other JSON serializable object. The analytics_logger supports two ways of logging the values:
-
One at a time:
analytics_logger.log(column=’my_column’, value=the_value) analytics_logger.log(column=’some_other_column’, value=yet_another_value) -
Multiple values at once:
analytics_logger.log_multi(
    values={‘another_column’: ‘some_value’, 'something_else': 123}
)
Note that adifferent function is used when we log multiple values (log_multi instead of log).
If you log different values with the same column name, only the last logged value will be logged (it overwrites previous logs).
Retrieve Custom Values
The JFrog ML Analytics view in the JFrog ML UI displays all the logged values with the column prefix logger_.
If analytics_logger.log(column=’my_column’, value=the_value) are ;logged, JFrog ML Analytics displays a column logger_my_column with a value retrieved from the variable the_value.
Updated 4 months ago