Prediction Timers
JFrog ML prediction timers help troubleshoot model prediction latency, measure prediction times, find bottlenecks, and optimize performance.
Configure multiple timers with custom names for clear visibility using either a context manager or a decorator.
After building, deploying and sending inference requests to your model, you can view these timers on the Latency breakdown graph.
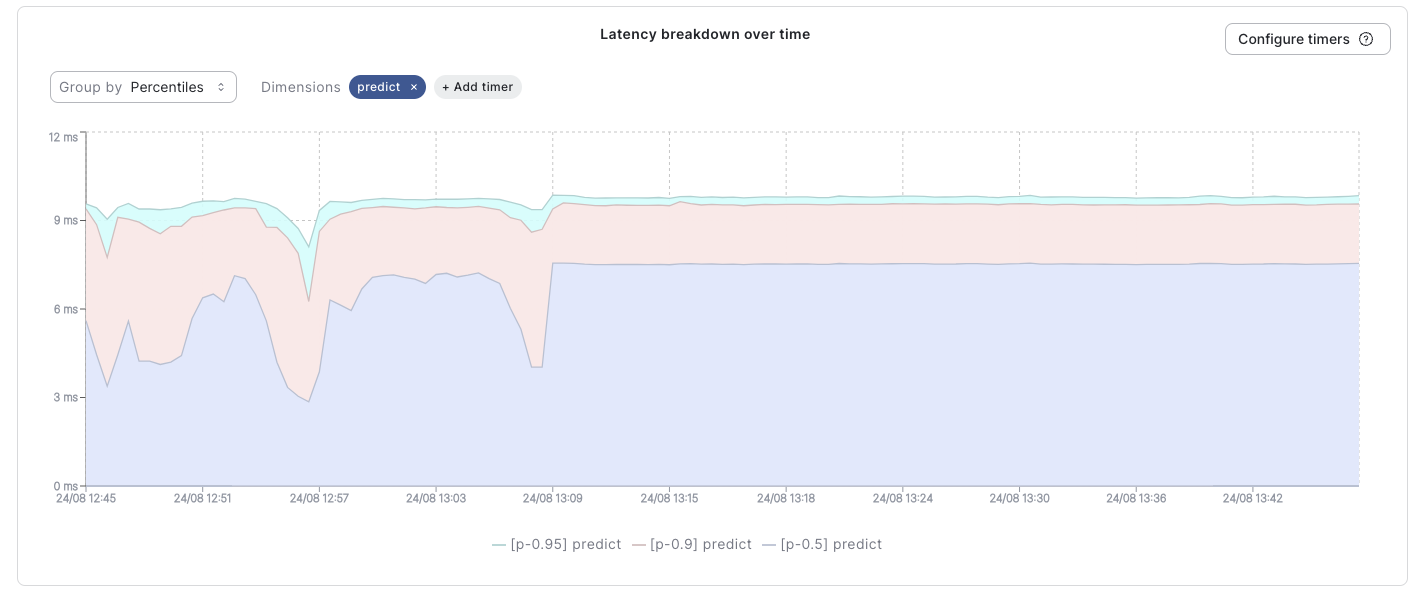
See the JFrog ML prediction timer in the Model Overview
Note
The prediction timer graph may display up to five (5) timers including the default
overallandpredicttimers. This leaves room for an additional three (3) custom timers.
Configure Timers via Decorators
Frog ML timers can be configured using function decorators, enabling you to easily wrap and time specific methods executed during the prediction process.
from frogml import frogml_timer
from frogml import FrogMlModel

class MyModel(FrogMlModel):
    def build(self):
        pass

    @frogml_timer("my_custom_timer_name")
    def pre_process(self, df):
        # Perform custom processing
        return df

    def predict(self, df):
        self.pre_process(df)
        return df
Configure Timers via Context Managers
Use the context manager to (configure JFrog ML timers and) measure specific logic blocks within your code without defining a separate function.
from frogml import frogml_timer
from frogml import FrogMlModel

class MyModel(FrogMlModel):
    def build(self):
        pass

    def predict(self, df):
        with frogml_timer("my_custom_timer_name"):
            # Perform custom processing
            df = df + 1

        return df
Monitor Default Timers
JFrog ML automatically tracks these two metrics for every request:
Overall Timer: Measure the end-to-end inference time, starting from the moment a request arrives until the inference output is sent.
Queue Timer: Measures the time requests wait in the input queue before reaching the model.
Understanding Latency Metrics
When analyzing model runtime latency charts, distinguish between the two key metrics, Overall and Predict latency to identify where bottlenecks occur.
Overall Latency (Infrastructure view): This metric measures the full request lifecycle, the time elapsed from when a request reaches load balancer to the moment a response is sent back to the user. This includes several infrastructure-level processes, largely outside of your control, such as:
- Request routing mechanisms
- Authentication and authorization procedures
- Network communication between containers
Predict Latency (Code view): This is the granular perspective, specifically focusing on the execution time of your specific Python predict method.
Factors Inflencing Overall Latency
While "Overall Latency" is infrastructure-heavy, you can influence these specific components via configuration:
- Webserver Queueing: The duration requests spend waiting in the webserver before processing begins (waiting for a worker to become free).
- Serialization/Deserialization: The time taken to convert data into and out of suitable formats (for transmission and your model). (Dependent on adapter choice and data size).
- Context Switching: The overhead from switching between differet workers/threads within your deployment.
- Model Loading: The time required to load your model into the memory of your worker (critical when number of workers > available threads).
Optimize Overall Latency:
To reduce latency caused by the factors above, adjust your resource allocation strategy:
- Instance Type: Select an instance type with appropriate CPU, memory, and network capabilities.
- Instance Count: Scale the number of deployed instances to match the request volume.
- Workers per Instance: Tune the worker-to-instance ratio.
Note: Increasing the number of workers does not guarentee better performance. It may increase latency due to frequent model loading and context switching overhead.
Conclusion
By understanding these latency factors and implementing strategic resource allocation, you can optimize system performance and responsiveness.
Updated 4 months ago