

AI/ML Overview Dashboard
Monitor AI models, MCP servers, and gateway usage from the JFrog Platform AI/ML Overview page.
In the JFrog Platform, go to Platform > AI/ML > Overview. Use this page as your central command center for monitoring and managing your organization's AI and machine learning assets. It provides a real-time summary of asset health, model inventory, MCP server configuration, and runtime activity across all projects.
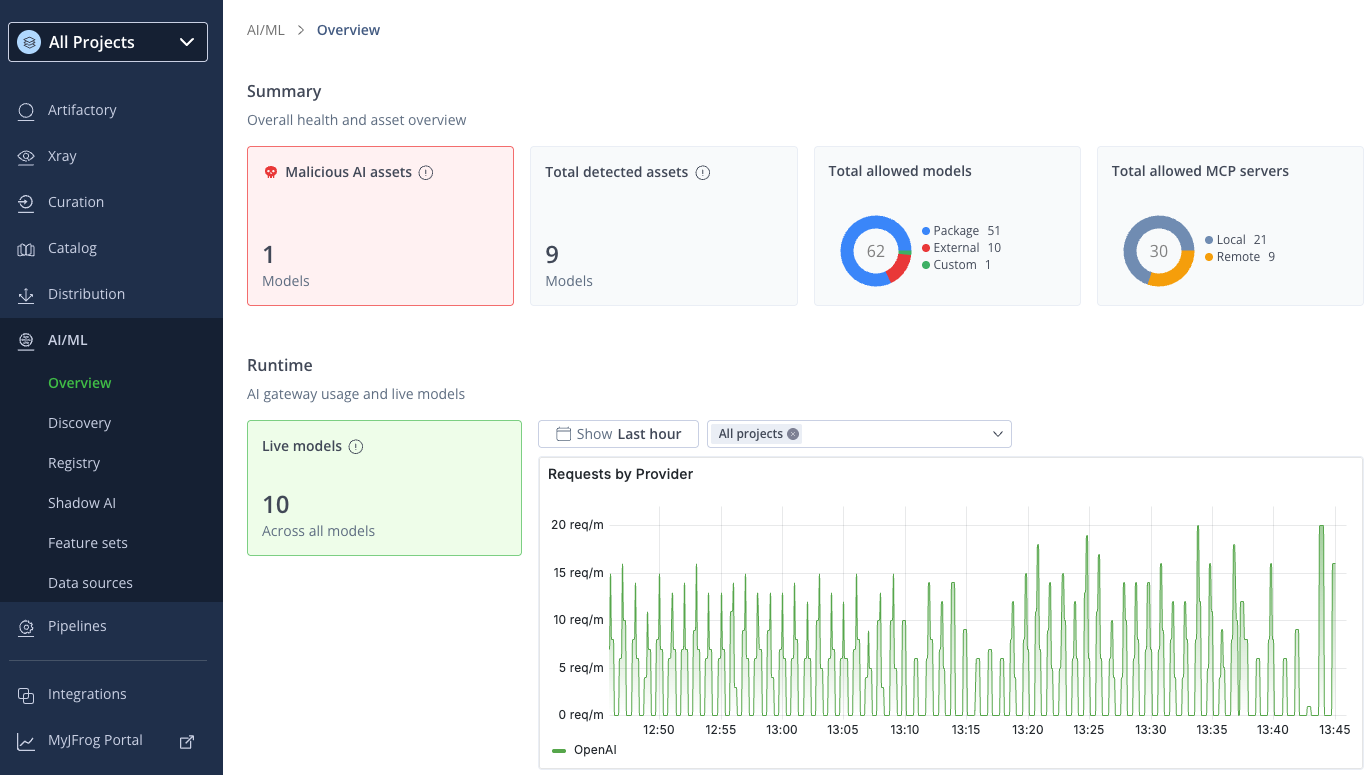
Summary Section
The Summary section displays high-level inventory and security status cards for AI models and MCP servers across your organization.
| Card | Description |
|---|---|
| Malicious AI Assets | Displays a security status indicating whether any malicious models or MCP servers have been detected. When no threats are found, the card shows a success indicator. Clicking Show All opens the Detect Shadow AI page for model detection workflows. For more information about governing MCP servers, see MCP Registry Overview. |
| Total Detected Assets | Shows the total number of AI models currently detected across your environment. |
| Total Allowed Models | A donut chart breaking down allowed models by type: Package, External, and Custom. |
| Total Allowed MCP Servers | A donut chart showing the number of allowed MCP servers, segmented by Local and Remote. |
Runtime Section
This section provides live operational data about AI gateway usage and active models.
| Component | Description |
|---|---|
| Live Models | Displays the number of models currently active across all projects. |
| Requests by Provider | A time-series chart showing AI gateway request volume, filterable by time range (for example, Last Hour) and by project. The chart shows "No data" when no requests have been recorded in the selected window. |
Related Topics
Updated 3 months ago
Did this page help you?