Log Files Location and Naming
For each JFrog service, you will find its active log files in the $JFROG_HOME/<product>/var/log directory. For consistency, each log file is prefixed by its service name and a dash, <service-name>-service.log. For example, artifactory-service.log and router-request.log.
The following log files are included for all JFrog Services.
Value | Example | Description |
|---|---|---|
Service Log |
| Main service log file for each microservice, containing data on the service activity. |
Request Log |
| Lists all http requests (including gRPC) that were made to the service. |
Outbound Request Log |
For example: | Lists all the remote requests initiated by a remote repository and replication. |
Console Log |
| Combined log file that contains server activity for all microservices. In Windows, microservices will have separate console log files named |
Tip
Administrators working in a self-hosted environment can use REST APIs to temporarily change the debug level of Artifactory loggers without changing the logback.xml file. This can be used to collect more detailed log information for a short period of time when investigating a particular issue. For more information, see LOGGERS.
Archived Logs
Each log file has a default rolling policy, which will compress the log file and move it to the $JFROG_HOME/<product>/var/log/archived folder.
Log File Structure
The Request and Access log files each display a specific type of activity and as such, have a consistent and specific file structure for maximum readability.
Service Log
The service log file console pattern uses colors to highlight the service type and message level. On Windows, console colors should be disabled.
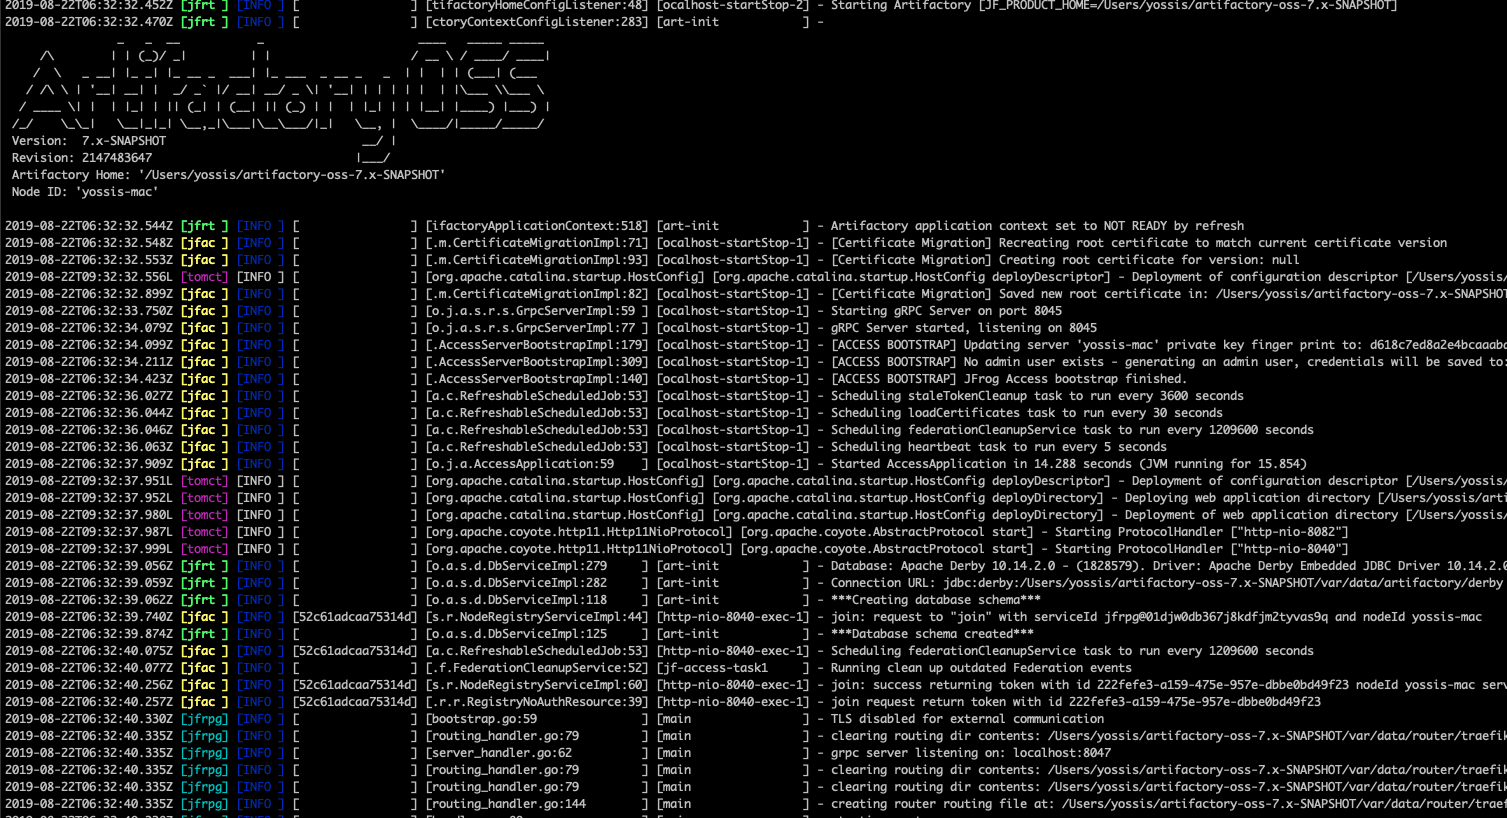
Service log file record structure
Timestamp (UTC) [Service Type] [Level] [Trace Id] [Class and Line Number] [Thread] - MessageService log file record sample
2018-11-18T15:39:04.902Z [jfac ] [INFO ] [4b1b8a0b04e31b80] [s.r.NodeRegistryServiceImpl:44] [http-exec-4 ] - request to "join" with serviceId jffe@000Value | Description | Example |
|---|---|---|
Timestamp | The date and time the message was logged, in UTC time with the standard format: [yyyy-MM-dd'T'HH:mm:ss.SSSZ] based on RFC-3339 |
|
Service Type | The service type, color coordinated with a specific color for each service, including: • Artifactory: Bright Green • Access: Yellow • Event: Bright Cyan • Router: Cyan • Tomcat: Magenta • Metadata: Bright Blue • Xray: Yellow Cross-product services (such as router, tomcat, scripts) use the same color. |
|
Service Identifier | A code that identifies the microservice. See Service Identifiers . |
|
Trace Id | The trace id value. Trace id is used to identify a request across services Example: 4b1b8a0b04e31b80 |
|
Class and Line Number | The fully qualified class name and line number printing this log entry. Example: s.r.NodeRegistryServiceImpl:44 |
|
Thread | The thread printing this log entry. "main" if not java. Example: [http-exec-4 ] |
|
Message | The log entry message. |
|
Service Identifiers
| JFrog Product | Service Name | Service ID |
|---|---|---|
| Artifactory | Artifactory | jfrt (legacy: jf-artifactory) |
| Artifactory | Access | jfac (legacy: jf-access) |
| Artifactory | Router | jfrou |
| Artifactory | Metadata | jfmd |
| Artifactory | Frontend | jffe |
| Artifactory | Event | jfevt |
| Artifactory | JFConnect | jfcon |
| Artifactory | Mission Control | jfmc |
| Artifactory | Integration | jfint |
| Artifactory | Observability | jfob |
| Xray | Server | jfxr |
| Xray | Analysis | jfxana |
| Xray | Indexer | jfxidx |
| Xray | Persist | jfxpst |
| Xray | Indexer-App | jfxia |
| Distribution | Distribution | jfds |
| Distribution | Distributor | jfdr |
| Mission Control (Below version 4.7) | Mission Control | jfmc |
| Mission Control (Below version 4.7 | Insight Server | jfisv |
| Mission Control (Below version 4.7 | Insight Schedular | jfisc |
| Pipelines | extensionsync | jfpes |
| Pipelines | Logup | jfplog |
| Pipelines | Marshaller | jfpmar |
| Pipelines | Hook Handler | jfphh |
| Pipelines | Nexec | jfpnex |
| Pipelines | Cron | jfpcrn |
| Pipelines | Step Trigger | jfpst |
| Pipelines | Run Trigger | jfprt |
| Pipelines | Pipeline Sync | jfpps |
| Pipelines | Template Sync | jfpts |
| Pipelines | Request Sealer | jfprs |
| Pipelines | Frontend | jfpwww |
| Pipelines | Api | jfpapi |
| Pipelines | Pipelines router | jfprou |
| Installer | Installers Commons | jfin |
Request Log
The request log file pattern contains a list of pipe ("|") separated values. The file pattern will contain the same number of columns; if a value is missing, it will be empty.
If not provided by the client, the 'Request Content-Length' value is initialised as "-1".
Request log file record structure
Timestamp | Trace ID | Remote Address | Username | Request method | Request URL | Return Status | Request Content Length | Response Content Length | Request Duration | Request User AgentRequest log file record sample
2018-11-18T15:39:04.902Z|d5d75b3c41242768|127.0.0.1|anonymous|GET|api/v1/cert/root|200|0|6|0|JFrog Access Java Client/4.1.12Warning
The request log information is not indicative of your data transfer usage. You can view your data transfer usage in My Usage in MyJFrog and Enable Detailed Data Transfer Logs in MyJFrog to view detailed data transfer logs.
The following table lists the request log values and their descriptions.
Value | Description | Example |
|---|---|---|
Timestamp | The date and time the request was completed and entered into the log file, in UTC time with the standard format: [yyyy-MM-dd'T'HH:mm:ss.SSSZ]. |
|
Trace ID | The trace id value. |
|
Remote Address | The IP address of the remote caller (ipv4 or ipv6). |
|
Username | The requesting user's username or "anonymous" when accessed anonymously. |
|
Request method | The HTTP request method, in UPPERCASE. |
|
Request URL | The relative URL for the request. |
|
Return Status | The HTTP return code for the request. |
|
Request Content Length | The size of the user request in bytes, for example, the size of an uploaded file. -1 if unknown. | |
Response Content Length | The size of the server response in bytes, for example, the size of downloaded file. -1 if unknown (for example, chunked encoding). | |
Request Duration | The time in ms for the request to process. | |
Request User Agent | The request user agent. |
|
Outbound Request Log
The request-out log file pattern contains a list ofpipe ("|") separated values. The file pattern will contain the same number of columns, if a value is missing it will be empty.
Note: If not provided by the client, the 'Request Content-Length' value is initialised as "-1".
Request log file record structure
Timestamp | Trace ID | Remote Repository Name | Username | Request method | Request URL | Return Status | Request Content Length | Response Content Length | Request DurationRequest log file record sample
2021-05-12T13:58:46.686Z|40ea218a769325db|generic-remote|andreyt|HEAD|https://acme.jfrog.com/artifactory/generic-packages/jdbc-drivers/mssql-jdbc-7.4.1.jre11.jar|200|1219373|0|80Value | Description | Example |
|---|---|---|
Timestamp | The date and time the request was completed and entered into the log file, in UTC time with the standard format: [yyyy-MM-dd'T'HH:mm:ss.SSSZ]. |
|
Trace ID | The trace id value. |
|
Remote Repository Name | The name of the remote repository. |
|
Username | The requesting user's username or "anonymous" when accessed anonymously. |
|
Request method | The HTTP request method, in UPPERCASE. |
|
Remote URL | The URL for the remote resource. |
|
Return Status | The HTTP return code for the request. | 201 |
Request Content Length | The size of the user request in bytes, for example, the size of an uploaded file. -1 if unknown. | |
Response Content Length | The size of the server response in bytes, for example, the size of downloaded file. -1 if unknown (for example, chunked encoding). | |
Request Duration | The time in ms for the request to process. |
Router Request Log
The JFrog Router has a JSON based access log containing all the requests that went through the Router, including service-to-service communication.
Below is an example of an entry in the Router request log (router-request.log)
Router Request Log Entry
{
  "BackendAddr": "http://localhost:8049",
  "ClientAddr": "127.0.0.1:61899",
  "DownstreamContentSize": 2,
  "DownstreamStatus": 200,
  "Duration": 8353000,
  "RequestMethod": "GET",
  "RequestPath": "/router/api/v1/system/ping",
  "StartUTC": "2020-11-12T11:53:03.605300906Z",
  "request_Uber-Trace-Id": "4ccb40200c199346:1a3f95ce1b27711d:71e15f8b6031c9e9:0",
  "request_User-Agent": "curl/7.54.0",
  "time": "2019-08-05T14:42:09+03:00",
  "level": "info",
  "msg": ""
}| Value | Description | Example |
|---|---|---|
| BackendAddr | Address of the backend server the request was forwarded to | http://localhost:8049 |
| ClientAddr | The IP address of the remote caller in its original form (ipv4 or ipv6, usually IP:port). | 127.0.0.1:61899 |
| DownstreamContentSize | The number of bytes in the response entity returned to the client. | 2 |
| DownstreamStatus | The HTTP return code for the request. | 200 |
| Duration | The time in nanoseconds for the request to process. | 8353000 |
| RequestMethod | The HTTP request method, in UPPERCASE. | GET |
| RequestPath | The relative URL for the request. | /router/api/v1/system/ping |
| StartUTC | The date and time request processing has started, in UTC time with the standard format: [yyyy-MM-dd'T'HH:mm:ss.SSSSSSSSSZ]. | 2020-11-12T11:53:03.605300906Z |
| request_Uber-Trace-Id | The full trace id value. | 4ccb40200c199346:1a3f95ce1b27711d:71e15f8b6031c9e9:0 |
| request_User-Agent | The request user agent. | curl/7.54.0 |
| time | The date and time the request was completed and entered into the log file, in UTC time with the standard format: [yyyy-MM-dd'T'HH:mm:ss.SSSZ] | 2019-08-05T14:42:09+03:00 |
| time / msg | Default info and empty message |
Console Log
The console log file appends the console outputs of all services into one common log file.
Log rotation is configured to occur every hour using a cron job for Docker Compose and native installations.
Log rotation is not available in the following installations:
- Archive
- Mac/Windows
- Manual Docker Compose (which don't use the bundled script)
Since this file is written to by all services and can grow quickly, it is recommended to manage it by either by disabling it using the
shared.logging.consoleLog.enabledconfiguration in the Artifactory System YAML,or by setting up your own log rotation.
Note
You have to configure log rotation manually for Tomcat logs. For more information, see Configuring Log Rotation for Tomcat.
View Log Files from the UI
You can view essential Platform log files from the UI.
Important Details
This feature is supported on a JFrog Self-Hosted solution only.
-
In the Administration module, go toMonitoring > System Logs.
-
Select the JFrog service you want to view logs for.
-
Select the node.
-
Select the file you want to view.
The log tail view is automatically refreshed every few seconds, however, can be paused and resumed if you wish to browse the log.
Tip
To save system resources, do not leave the log view open in your browser unnecessarily.
Send Logs to Syslog
Some sites want to consolidate logs into the syslog facility. The following steps enable you to send your Java microservices logs to syslog.
Configure the logback library
Edit the logback xml file in the $JFROG_HOME/<product>/var/etc/<microservice>/logback.xml file. For example, to configure Artifactory to use syslog, edit the $JFROG_HOME/artifactory/var/etc/artifactory/logback.xml file.
-
Add the following syslog appender to the logback xml (next to the other appenders)
<appender name="SYSLOG" class= "ch.qos.logback.classic.net.SyslogAppender"> <syslogHost>localhost</syslogHost> <facility>SYSLOG</facility> <suffixPattern>[%thread] %logger %msg</suffixPattern> </appender> -
Add the following appender to the output:
<root> <level value="warn"/> <appender-ref ref="CONSOLE"/> <appender-ref ref="FILE"/> <appender-ref ref="SYSLOG"/> </root> -
Save the file, and restart the service.
Configure syslog on your machine
Since logback uses internet sockets, you must ensure that your syslog facility accepts them. Modern Linux distributions are using the rsyslog daemon for syslogging. Ensure that the configuration for internet domain sockets is enabled, either by editing/etc/rsyslog.confand uncommenting:
# Provides UDP syslog reception
$ModLoad imudp
$UDPServerRun 514
# Provides TCP syslog reception
$ModLoad imtcp
$InputTCPServerRun 514
or placing it in a file under/etc/rsyslog.dending in .conf.
Restart rsyslog.
service rsyslog restartConfigure Log Verbosity with Logback for Java-based Microservices
You can configure the verbosity of any Java-based logger in your system by entering or modifying the level value in the corresponding entry in the Logback configuration file JFROG_HOME/<product>/var/etc/<microservice>/logback.xml. For example, to configure the Artifactory log verbosity, edit the $JFROG_HOME/artifactory/var/etc/artifactory/logback.xml file.
Changes made to the logging configuration are reloaded within several seconds without requiring a restart.
Modifying the verbosity of a logger in logback.xml
<logger name="org.artifactory.http.out" level="debug"/>Configure Log Verbosity with System YAML for Non-Java Microservices
You can configure the verbosity of any non-Java-based logger in your system by entering or modifying the level value in the corresponding entry in the system.yaml configuration file JFROG_HOME/<product>/var/etc/system.yaml.
Changes made to the logging configuration require a restart.
Modifying the verbosity of a logger in system.yaml
frontend:
  logging:
    application:
      level: info