Workers Troubleshooting
From Artifactory Cloud version 7.89, the JFrog Platform stores event data from failed Worker executions. Optionally, select to view successful executions in the troubleshooting tab as well, to store data from both successful and failed runs.
Starting from Artifactory 7.115.2, you can also re-run Workers to troubleshoot both successful and failed Worker executions. The JFrog Platform uses Redis to store troubleshooting data.
Troubleshooting is enabled by default for Cloud environments: You can view the data in the Troubleshooting tab of the Workers screen in the JFrog Platform UI, or use the Execute Test API to retrieve the events.
For Self-Hosted environments, Troubleshooting is not enabled by default. For more information about enabling and configuring it, see Enable Troubleshooting in Self-Hosted Instances.
Workers' logging commands must be included in the Workers' script to collect log data, which you see in the Log tab of the Workers screen in the JFrog Platform UI. For more information, see Workers Troubleshooting Log Sample Code.
View Workers Run History
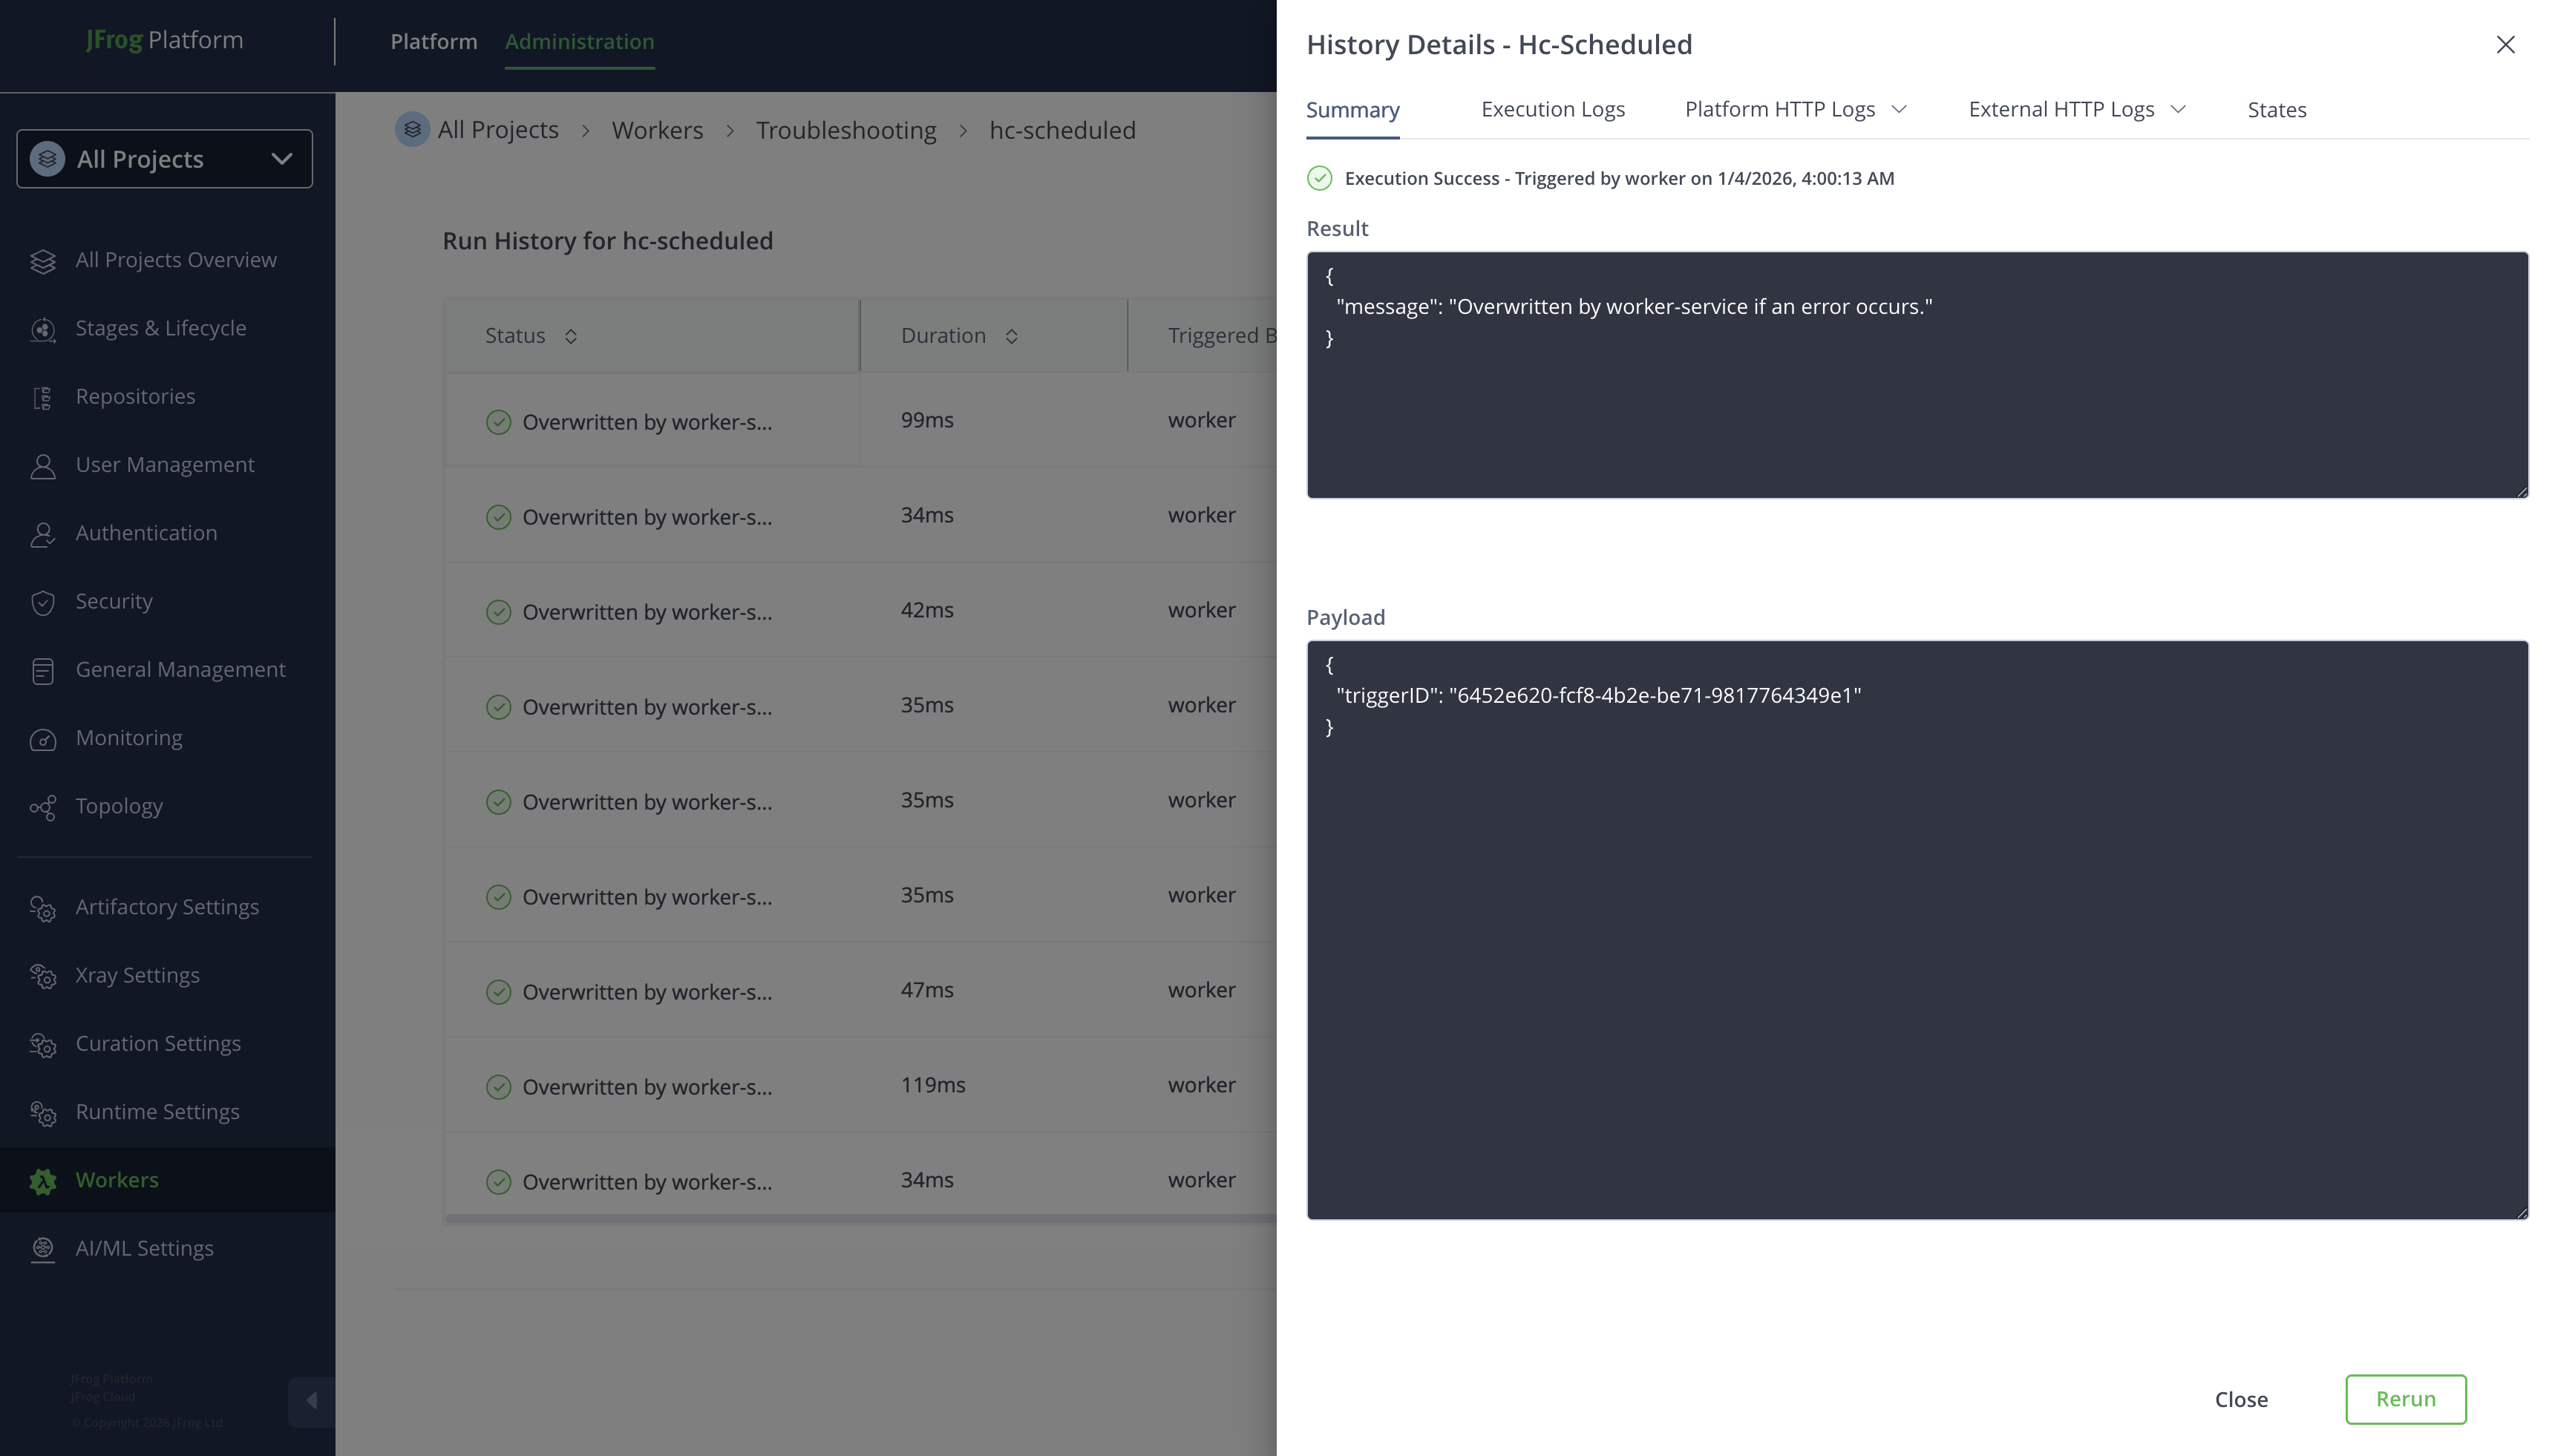
This topic describes how to view the run history of the configured workers. It provides guidance on how to review specific details, including status, event, the duration of each worker operation, last triggered by, last triggered, customizing table columns, and applying filters to view the desired information.
To access Worker run history:
-
From the Projects drop-down list, click All Projects, or your desired project.
-
From the Administrator module, click Workers.
The Workers page appears.
-
Click a Worker name on the list: under the Troubleshooting tab, you can view the Run History of the worker.
This section contains the following topics:
Run History Table Fields
| Field | Description |
|---|---|
| Worker Name | The name of the Worker |
| Project | The name of the project |
| Status | The status of each Worker run execution |
| Event | The type of Worker event |
| Actions | The actions you can run on the Worker: click Rerun to rerun the worker |
| Duration | The duration of the Worker run |
| Last Triggered By | Indicates the action that last triggered the Worker |
| Last Triggered | Indicates when the Worker was last triggered |
Customize Table Columns
Arrange the table columns according to how you want to view them.
Follow these steps to display and arrange the columns:
- From the Table header, click the Customize Columns at the end.
- Select which columns to display in the Customize Columns pop-up and drag and drop to reorder them.
- Click Apply.
Apply Filters to Sort Runs
To apply filters, follow these steps:
-
Click the
 Filter icon from the top right above the table header.
 -
Apply the following fields as you want to sort:
| Name | Description |
|---|---|
| Worker Type | Enter the name of the worker type |
| Worker Type | Check this field to view the run history of the particular worker type |
| Status | Enter the status of the worker |
| Product | Enter the product |
- To remove applied filters, click Clear all.
Rerun Worker Runs
Starting from Artifactory version 7.115.2, you can rerun specific Worker runs to troubleshoot them.
To rerun a Worker:
- Enter the Run History page for a Worker
- Find the run you want to rerun, and click the Rerun button under the Actions column.
- Review the payload and select the Save successful rerun results checkbox if you would like to save successful runs, instead of only failed runs.
- Click Rerun. You can close the window, and the rerun will continue in the background. You can view the rerun progression in the run history page for the Worker.
Workers Troubleshooting Log Sample Code
For a worker to generate log entries when the worker runs, you must use the console output in the worker scripts. For Worker's sample code, see Artifactory Workers Code Samples.
The following section provides sample code for a Before Download Worker with debug (console.debug), info (console.info), error (console.error), and warning (console.warn) information captured for the log. Note that the log should follow the same order - debug, info, warn, and error.
{
export default async (context: PlatformContext, data: BeforeDownloadRequest): Promise<BeforeDownloadResponse> => {

   console.debug("This is a debug log line.");
   console.info("Log something");
   console.error("Something is wrong!");
   console.warn("It is getting serious!");
   return {
       status: 'DOWNLOAD_PROCEED',
       message: 'proceed',
   }
}-
From the Projects drop-down list, click All Projects or your desired project.
-
From the Administrator module, click Workers.
The Workers page appears.
-
Under the Troubleshooting tab, you can view the Run History of workers.
-
Click the worker for which you want to view Summary, Logs, and States.
Enable Troubleshooting in Self-Hosted Instances
The Troubleshooting feature for Workers is not enabled by default in Self-Hosted JFrog instances.
To enable Troubleshooting in your Self-Hosted instance, modify these lines in your system.yaml file:
worker:
    execution:
        history:
enabled: trueNote
By default, troubleshooting entries are saved in a log file in the same location as the application logs. However, this is not the recommended mode for the following reasons:
- Every time the log file reaches a limit, all entries will be erased instead of being truncated.
- If Worker Service runs over multiple nodes, each node will store its own troubleshooting data, resulting in a lack of consistency.
Instead, we recommend using Redis (or a Redis-like such as Valkey) storage by configuring the Worker Service with the Redis URL under
worker.execution.history.storageConfig.urland Redis details underworker.execution.history.storageConfig.params. See below for more details and example.
See the following example of a Troubleshooting configuration:
worker:
    execution:
        history:
            enabled: true
            storageConfig:
                url: "redis://localhost:6379"
                params: "mode=single;password=redispassword;username=redisuser;commandTimeoutMillis=3000;connectionTimeoutMillis=5000"
                maxEntrySizeKb: 300
                trimIntervalMillis: 600000
                maxTrimLength: 200
                streamTtlDurationSeconds: 8640
Parameters
Here is the full description of all parameters under worker.execution.history.storageConfig:
| Parameter | Type | Description | Default value |
|---|---|---|---|
url | String | The URL, must follow the pattern <protocol>://<valid_uri>. The protocol accepts the following values:
| “file://$JF_PRODUCT_HOME/var/log/” |
params | String | Storage connection parameters, separated by a semicolon. List of parameters:
|
|
maxEntrySizeKb | Integer | The limit in KB beyond which the entry will be truncated (essentially logs and custom data returned by the worker) | 130 |
trimIntervalMillis | Integer | Interval in milliseconds for trimming the history | 60000 |
maxTrimLength | Integer | Maximum number of entries in the history for a single Worker | 100 |
streamTtlDurationSeconds | Integer | Number of seconds the history is kept in the storage such as Redis or Valkey (does not apply for file system storage mode) | 1296000 |
Updated about 2 months ago