View Application Insights
View application details, post-release CVEs, DORA metrics, and blast radius details.
The insights page provides a dashboard of important application information including a listing of key application details, links to any critical CVEs detected in your trusted releases, DORA metrics, and blast radius details showing a clear picture of production exposure to vulnerability findings.
To view the application Insights page:
- In the JFrog Platform, select AppTrust > Applications.
- Click the name of an application in the table. The Insights tab is displayed by default.
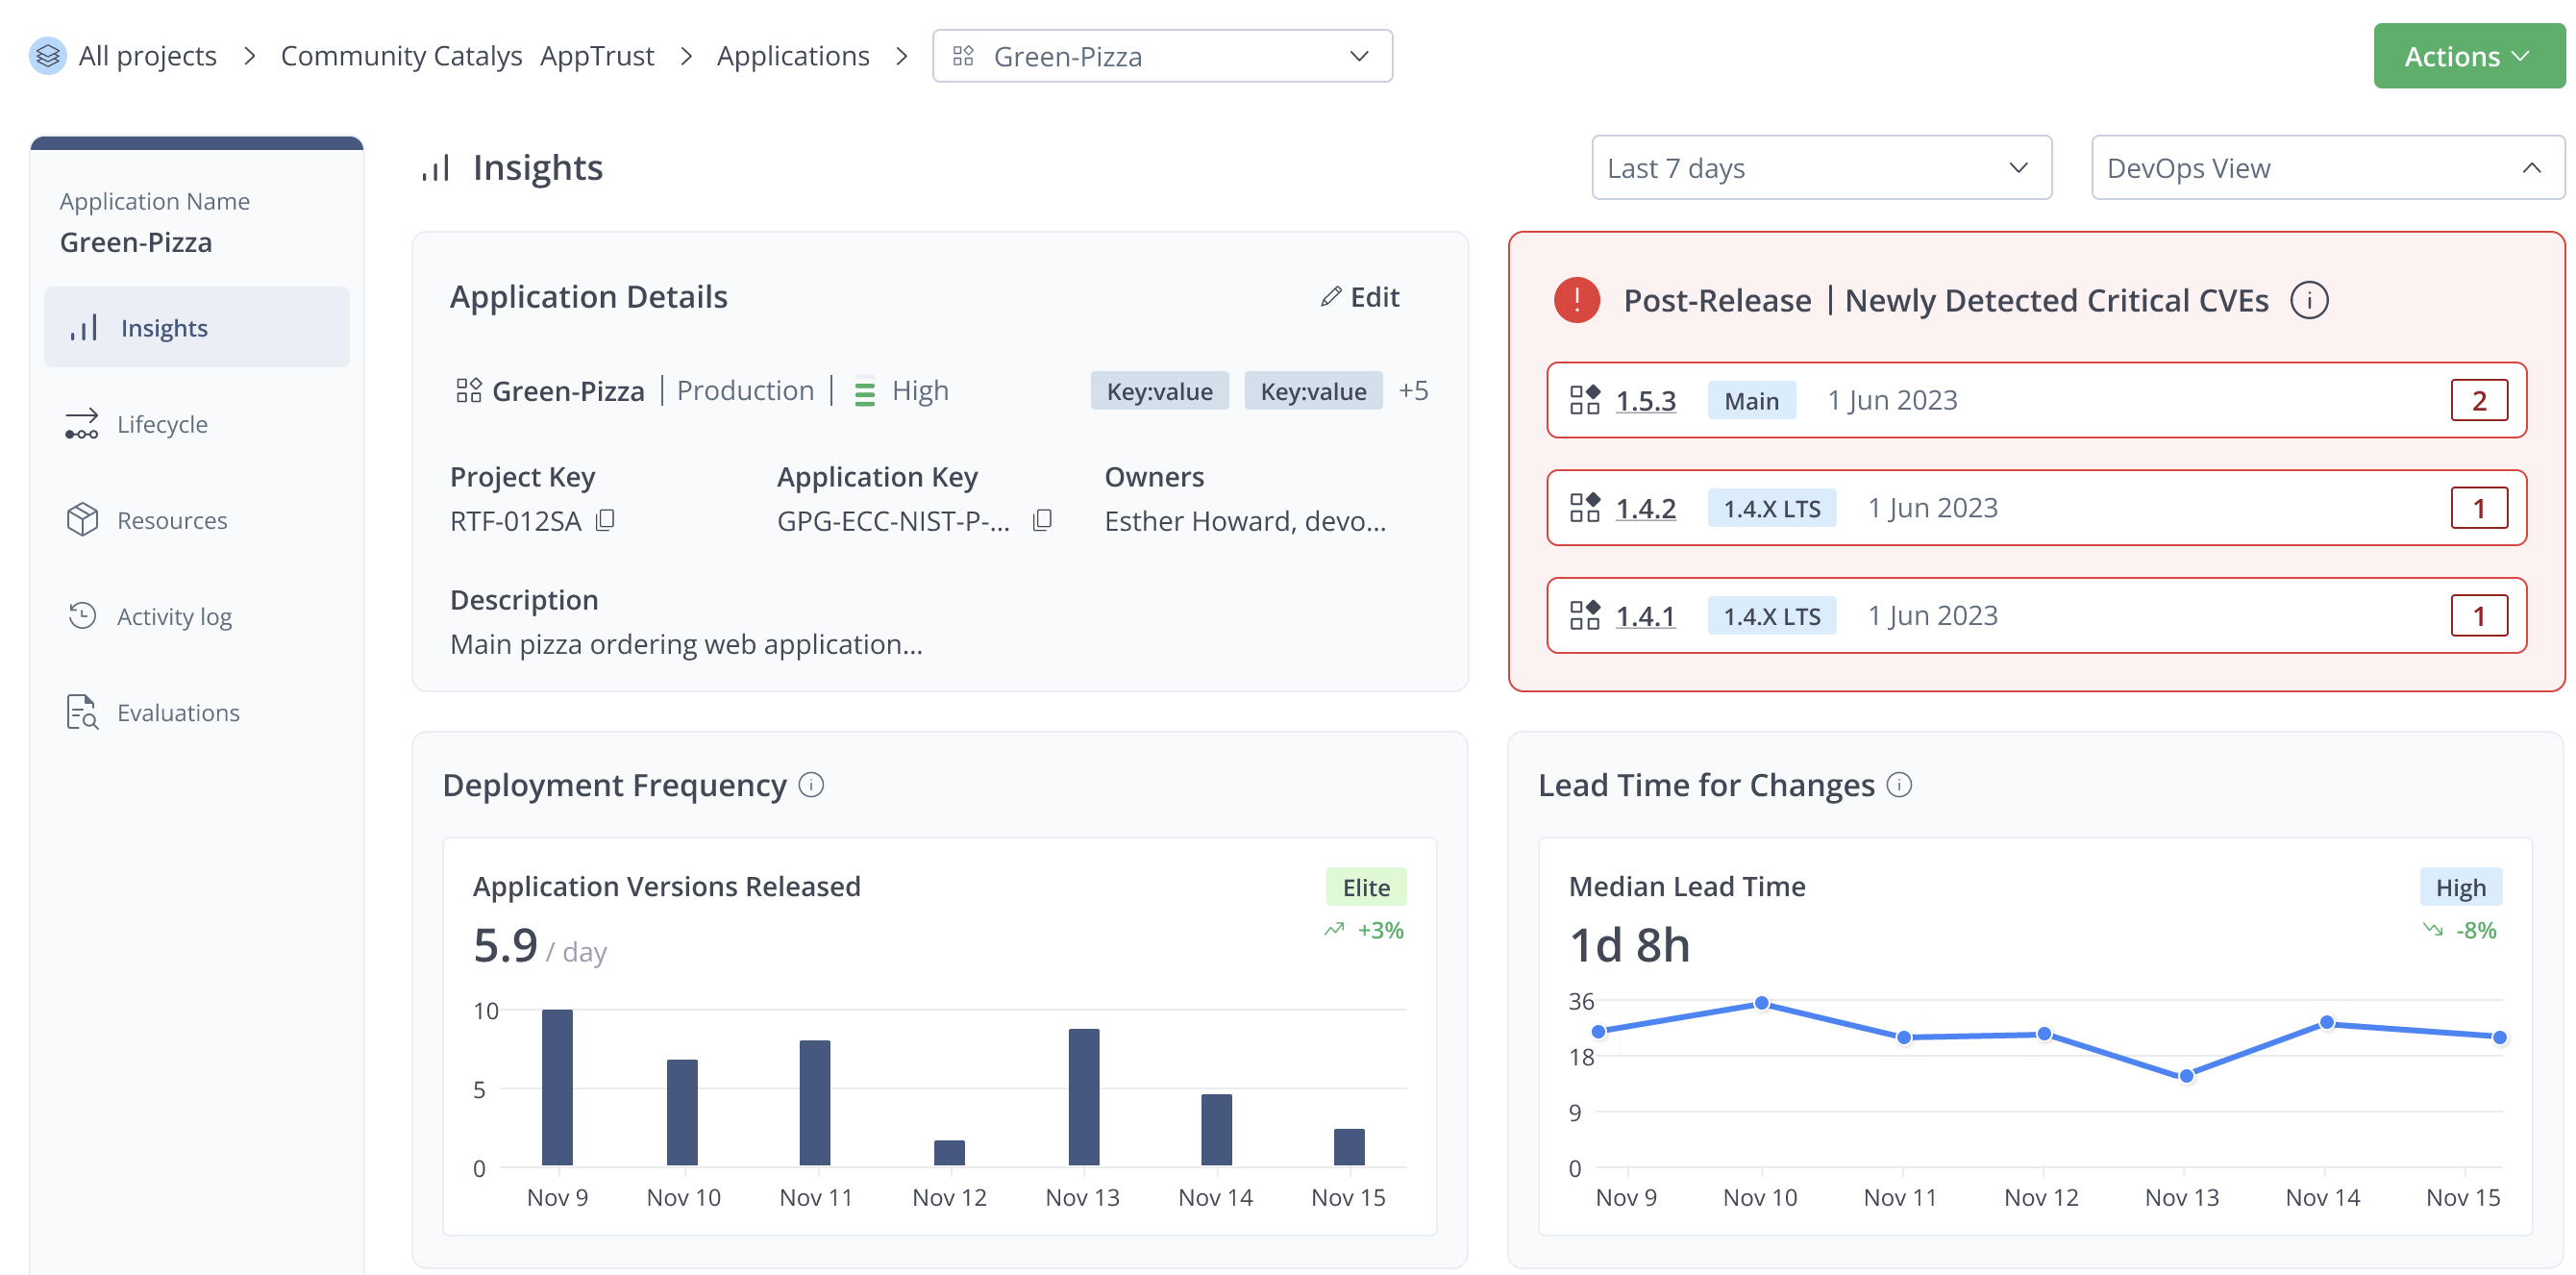
The Insights page contains the following information:
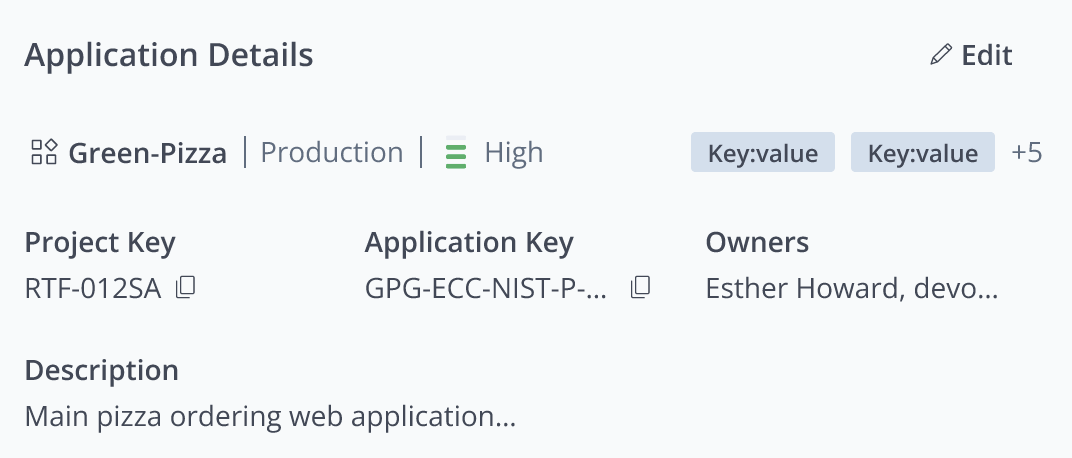
Application Details
This tile contains the key details about the applications, including its maturity, criticality, owners, labels, and description. Click the Edit icon to edit the application.
Trusted Release monitor
Even after an application version completes its lifecycle and is released, AppTrust can continue to monitor trusted releases for critical CVEs that can impact the users of your application. Any critical CVEs that are detected after release are mentioned here.
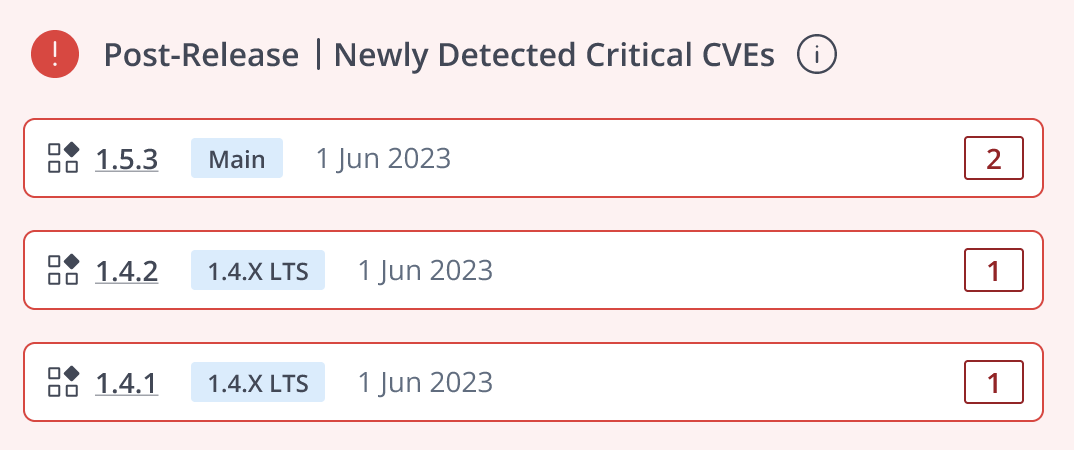
Tip: Click the CVE link to jump to the Risk tab, which provides details about the vulnerability that was detected post-release. For more information, see View the Risk Issues Detected in an Application Version.
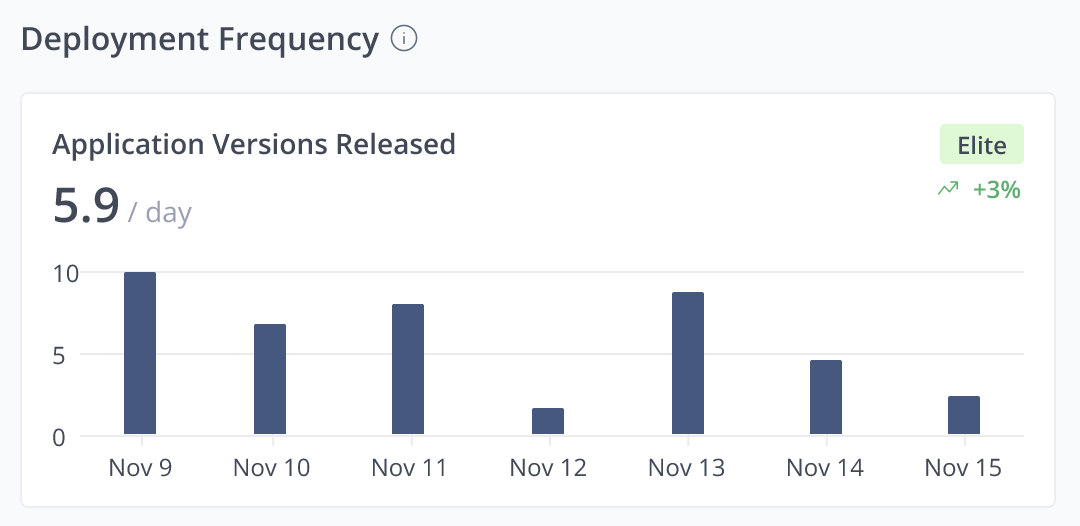
Deployment Frequency
Deployment Frequency is a standard DORA metric indicating how often code is successfully released to production. This is a method of measuring velocity, automation maturity, and continuous delivery.
This bar chart shows the number of application versions released per day. Hover over a bar to see the list of versions released on that day.
- Benchmark: A badge in the upper right of the chart shows a rating of Elite, High, Medium, or Low. A higher rating is given for more frequent releases during the time period. Hover over the badge to see how it was calculated.
- Trend Indicator: Below the badge, an arrow indicates an upward or downward trend in deployment frequency over the previous time period. The percentage indicates the strength of the trend compared to the previous time period.
Lead Time for Changes
Lead Time for Changes is a standard DORA metric indicating the time from code commit to successful production deployment. This is taken as a measure of efficiency of the development, testing, and release process.
This graph shows the median time it takes for a new application version to get from creation to production. A point on the graph represents the median lead time of the applications released on that day. Hover over the data point to see the versions released on that day and the actual lead time for each one.
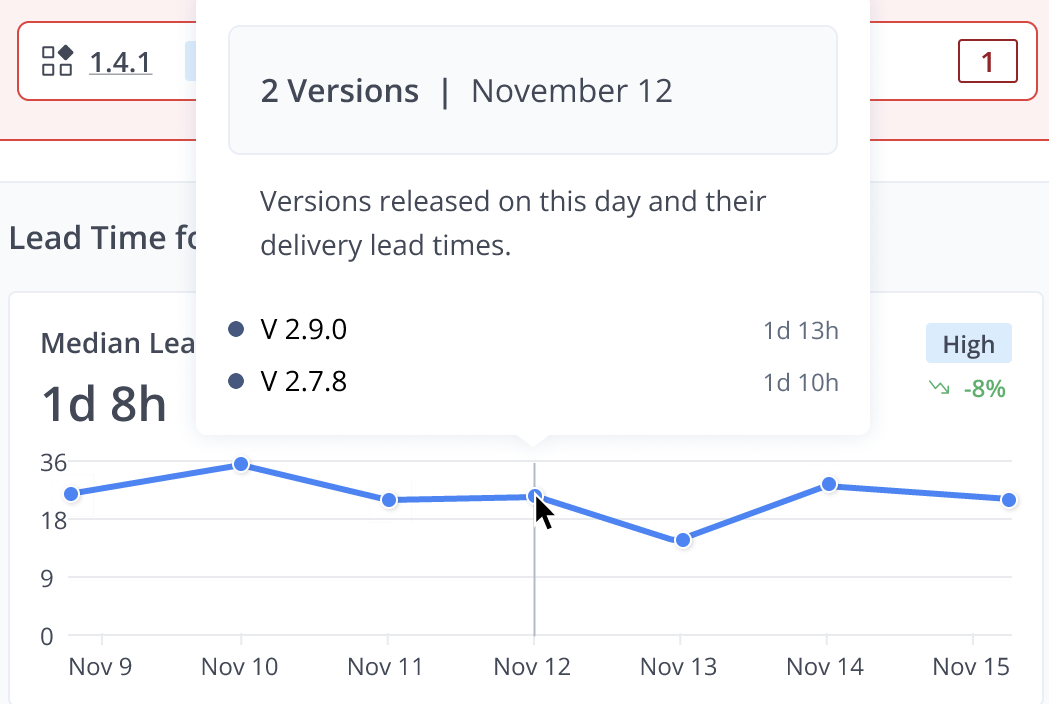
The graph shows a benchmark and a trend indicator similar to those for Deployment Frequency. A higher rating is given for shorter median lead times. Hover over the badge to see how it was calculated.
Blast Radius
Blast Radius turns vulnerability findings for a single application into a clear picture of production exposure. You can see which issues matter most for the stages you care about and how they connect from an affected package through your application versions to Production, QA, and other environments.
Blast Radius in the application level Insights shows data only for the business application in view and all of its versions in scope. Use it when you own or triage risk for a specific application and need to answer to what degree production is impacted.
The Blast Radius feature requires integration with JFrog Xray.
To view the application Blast Radius table:
- Scroll down the Insights page for the chosen application.
The default view of the table shows the top seven CVEs according to the calculated CVSS scores, with 10 being the most critical CVE.
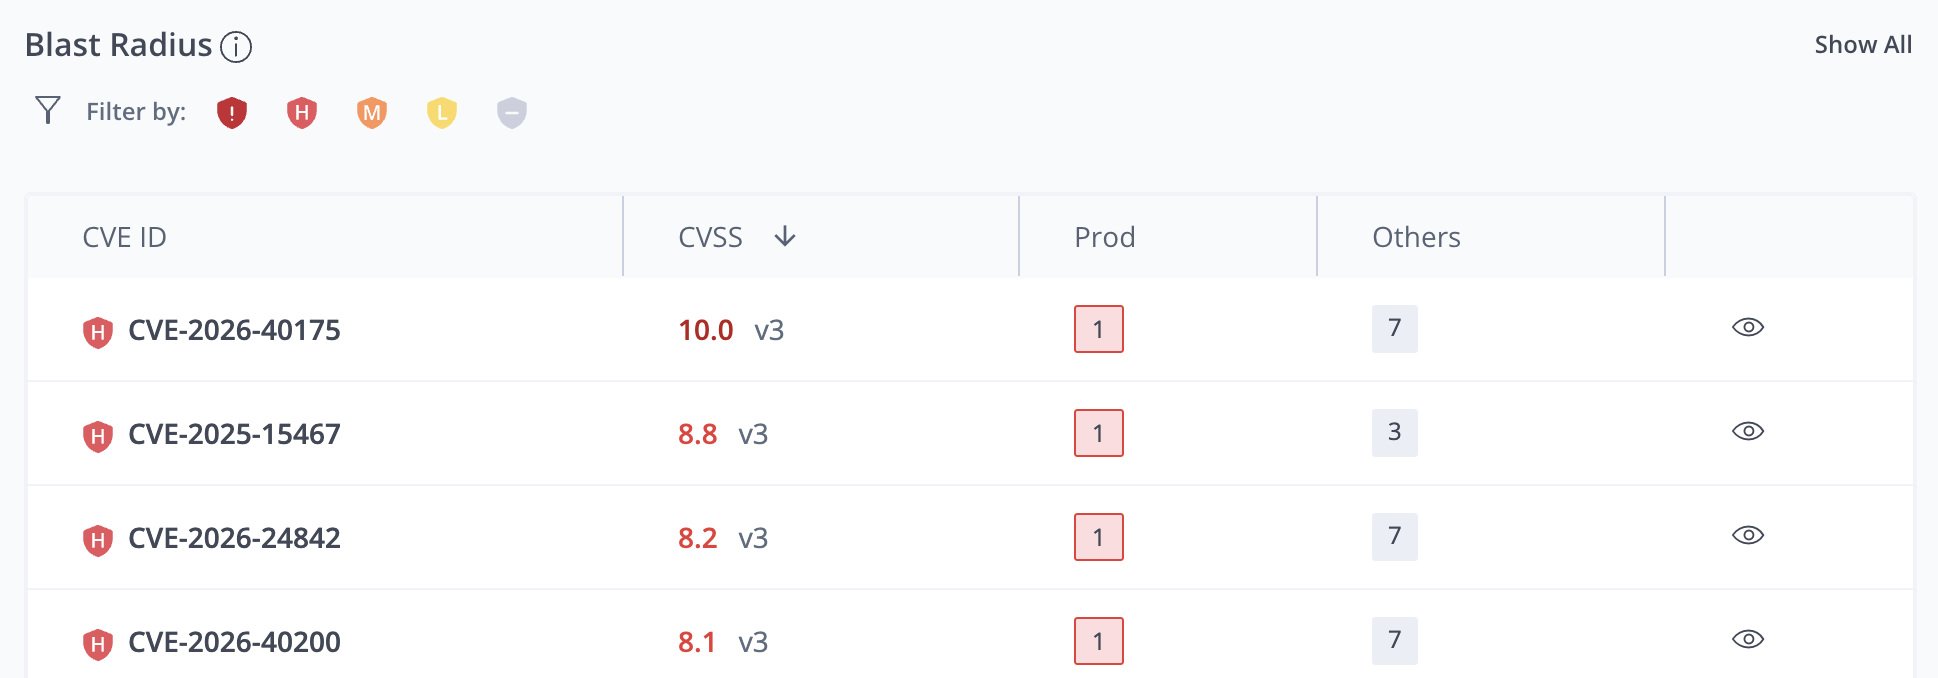
The Blast Radius table includes the following information:
- CVE ID: The code identifying the vulnerability or exposure and an icon indicating the severity.
- CVSS: The score according to the common vulnerability scoring system and the CVSS version. The following scoring ranges are used: Low (0.1–3.9), Medium (4.0–6.9), High (7.0–8.9), and Critical (9.0–10.0).
- Prod: The number of versions on Prod that have the vulnerability or exposure.
- Others: The number of versions in other (non-prod) lifecycle stages that have the vulnerability or exposure.
- View Impact (eye icon): Click the eye icon to see detailed information about the impact of this CVE.
Filter by:
To filter the CVEs by severity, click one or more of the icons above the table. For example, you can click the Critical and High icons to see just the critical and high CVEs, or you can click the Unknown icon to see just the CVEs that could not be ranked.
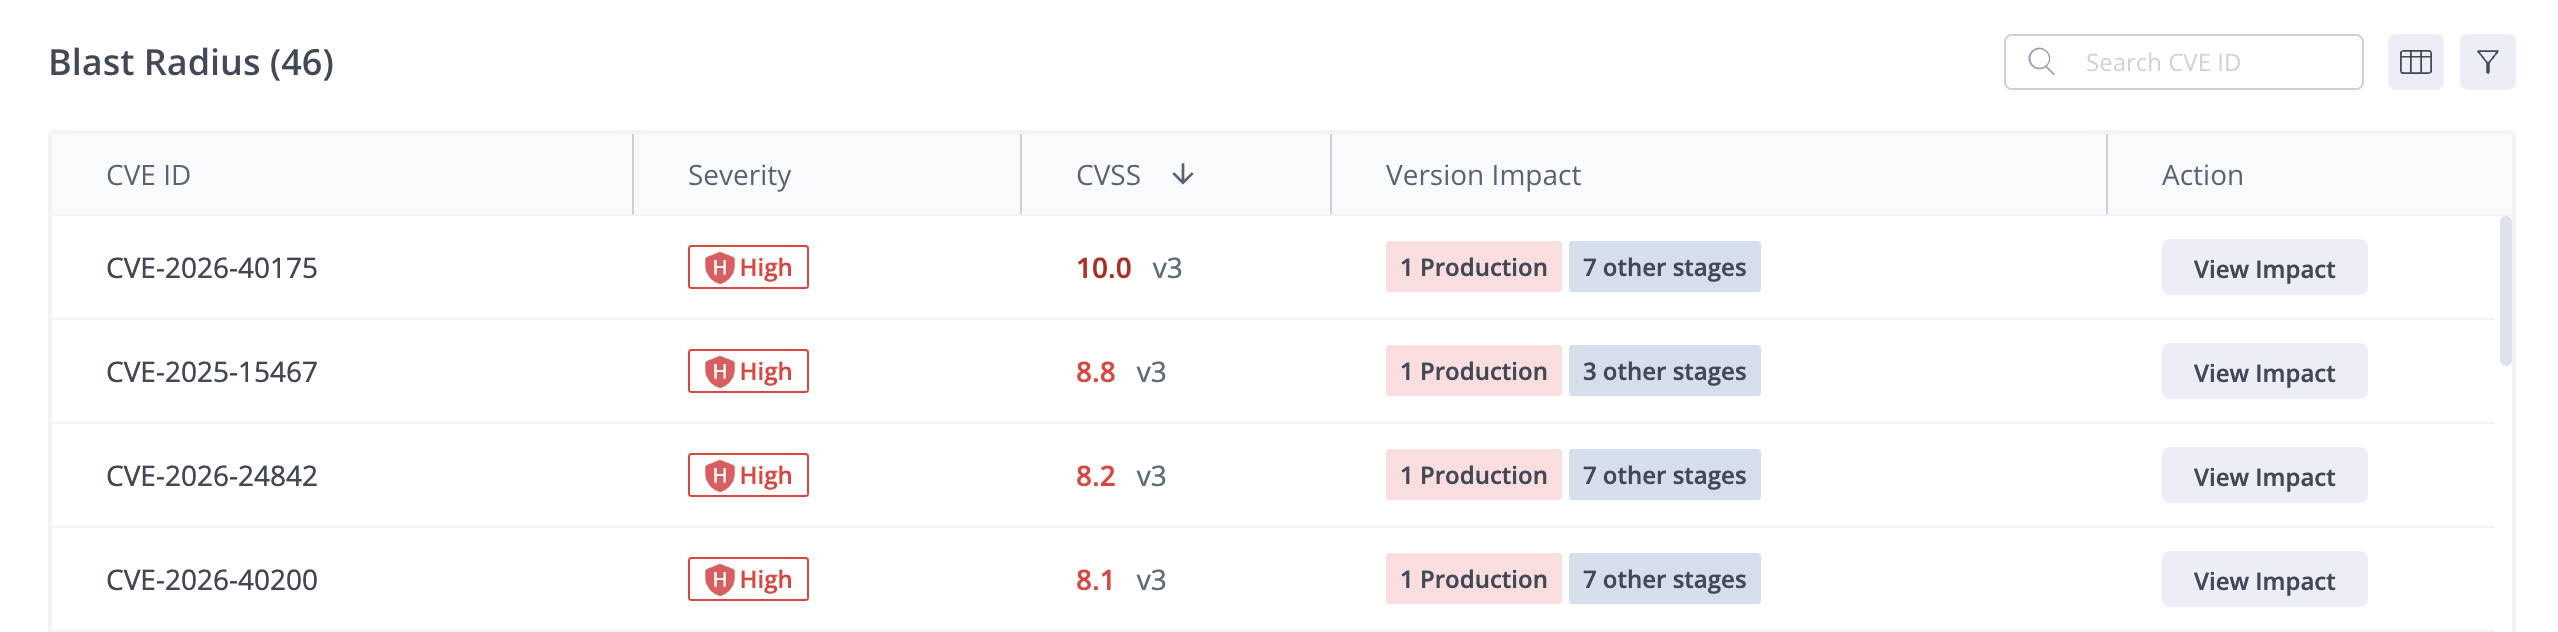
Show All
To open the full-size Blast Radius table, click Show All in the upper right corner of the Blast Radius area. This table shows the full list of CVEs and the same information about each CVE.
Impact Details
To see the full impact of a CVE, click the eye icon in the overview table or View Impact in the full view table.
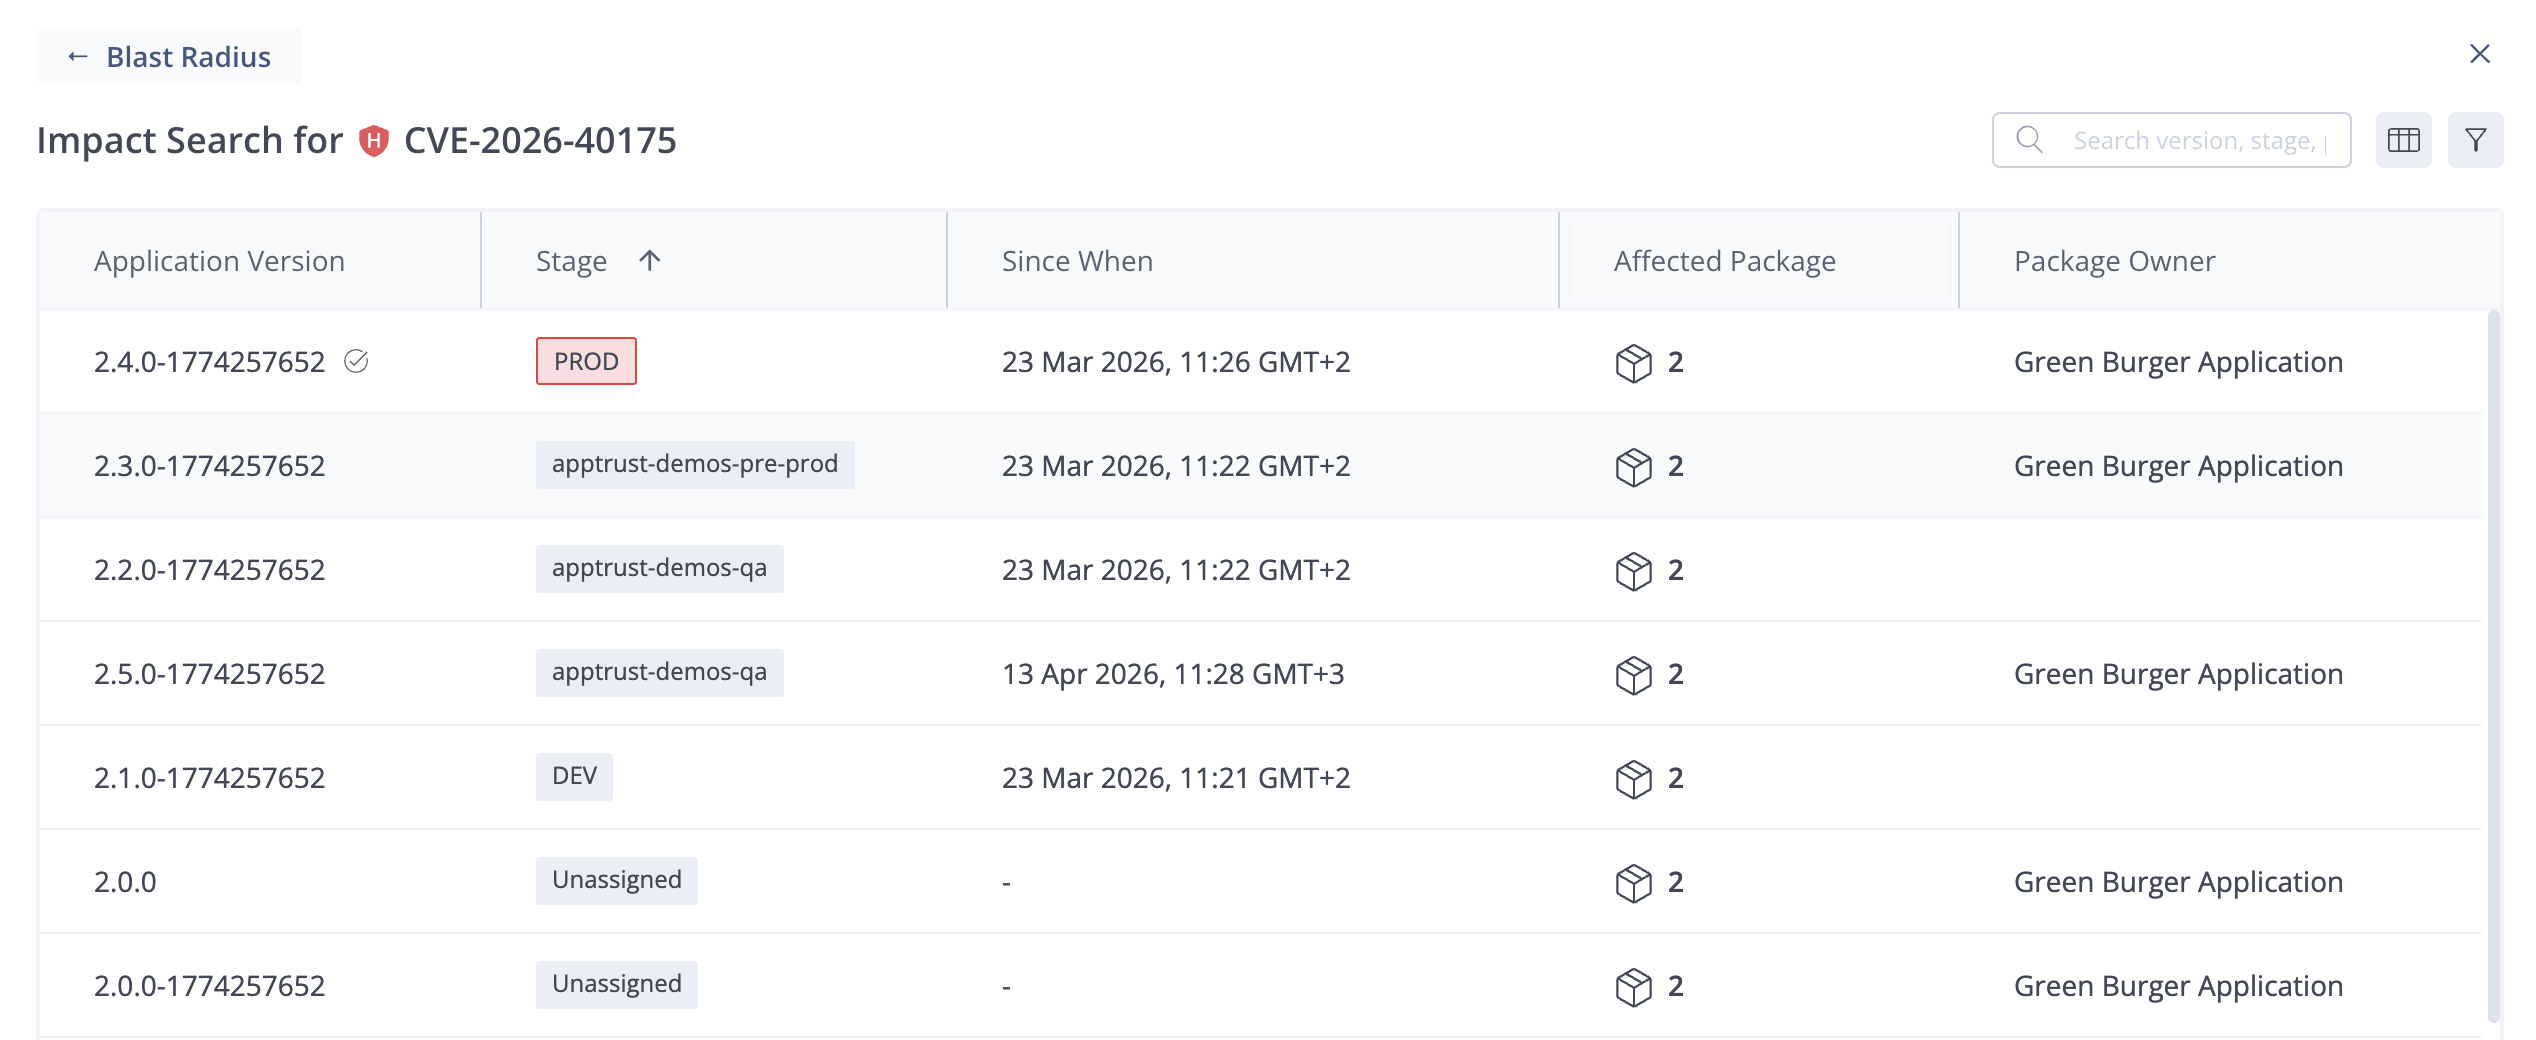
For the specific CVE, the Impact Search table shows the following information:
- Application Version: The version number of each impacted version.
- Stage: The current lifecycle stage of the impacted version.
- Since When: The date and time when the version was promoted to its current lifecycle stage.
- Affected Package: The number of impacted packages in the version and the affected package. When there are multiple packages affected, hover over the number to see a list of the packages.
- Package Owner: An owner is listed if one or more of the packages were bound to an application.
Updated about 2 months ago