

Open Metrics Reference
Track Federation performance using RTFS and legacy Open Metrics endpoints.
You can gather Federation performance data using metrics that comply with the Open Metrics standard. Third-party monitoring tools can access this data without the need for custom inbound API calls. The available metrics depend on whether you are using the Artifactory Federation Service (RTFS) or the legacy Federation service.
RTFS Custom Metrics
Note
On self-hosted JPDs, RTFS serves OpenMetrics (Prometheus-compatible) metrics at
GET https://<JPD_URL>/rtfs/api/v1/metrics. This endpoint requires a valid platform access token (Authorization: Bearer <token>). RTFS does not scrape this endpoint anonymously. For a full metric list, optional PromQL examples, and related administration context, see Open Metrics.The following tables use logical Micrometer-style names for Prometheus and Grafana queries. In Prometheus exposition (and therefore in Grafana), counters and other types often appear with extra suffixes. For example, a counter may be scraped as
jfrtfs_binary_tasks_total_count_by_status_totalrather thanjfrtfs_binary_tasks_total_count_by_status. Timers may appear as multiple series (for example,_count,_sum,_bucket). If a query using a name from this page returns no data, open the raw text from/rtfs/api/v1/metricsand use the exact series names returned there.Metrics whose names start with
jfrtfs_are emitted by RTFS from/rtfs/api/v1/metrics. Metrics whose names start withjfrt_federation_(see Legacy Federation Metrics) are Artifactory Open Metrics for the legacy federated-repository flow. They require the Artifactory federated metrics system properties and are exposed on Artifactory's metrics endpoint, not on the RTFS URL. Scraping only RTFS will not showjfrt_federation_*series.On self-hosted JPDs, RTFS metrics often include
tenant="rtfs_no_tenant". This is the default local/self-tenant placeholder. It does not indicate a missing tenant, configuration error, or degraded federation state. On SaaS or multi-tenant deployments, othertenantvalues may appear. For Datadog, Prometheus, or other tools, grouping or alerting ontenantis optional. You can ignore or filtertenant="rtfs_no_tenant". For federation health, use operational metrics (for example,jfrtfs_worker_lag_seconds,jfrtfs_worker_repo_lag_seconds,jfrtfs_members_in_status,jfrtfs_disabled_members) rather than thetenantlabel itself. These operational metrics correspond to the health states shown in the Connection States view.Support in
fluent-plugin-jfrog-metricsfor collecting RTFS metrics uses the same RTFS/rtfs/api/v1/metricspath. That integration affects how metrics are shipped to observability backends, not the names on the RTFS endpoint itself.
Metrics Granularity
Due to potential performance overhead, custom metrics are collected by default at the tenant level. Selected metrics can collect data at the repository key or member level if predefined thresholds are exceeded.
Warning
Implement and use granular metrics with caution due to their potential performance impact.
Lag Metrics
The following table lists RTFS lag metrics. jfrtfs_worker_lag_seconds and jfrtfs_worker_repo_lag_seconds report lag in seconds.
The HELP text for these metrics may still say that the lag is in milliseconds. Use the metric name and the value when you write queries and alerts. A lag of 5 minutes is a value of 300.
| Name | Description | Type | Granularity |
|---|---|---|---|
jfrtfs_worker_lag_seconds | Lag, in seconds, when transferring events to the remote member. Lag = Current time − Trailing baseline time, where trailing baseline time is either (a) the last processed event time, or (b) the trailing stream detection time (when the stream takes longer than the grace period to process the events it receives). | Gauge | Per tenant |
pq_queue_lag {queue_name="jfrog_federation_service_queue"} | Lag of the Artifactory Federation queue (in milliseconds). | Gauge | Per tenant |
jfrtfs_worker_repo_lag_seconds | Per-repository event-processing lag (seconds) for the highest-lag repositories. Use this series when you need member-level or repository-level lag from RTFS (compare with aggregate worker lag in jfrtfs_worker_lag_seconds). This gauge is emitted from RTFS lag state and appears only for repositories that meet all gating conditions at collection time. The stream has positive lag and is eligible for lag tracking. The lag exceeds the configured worker lag threshold (default 120 seconds). The repository is among the top lagging repositories selected for publication (limited by WORKER_LAG_TOP_REPOS_LIMIT). Because this is a dynamic gauge, it may be absent even during troubleshooting windows (for example, lag dropped back to zero before the next scrape). | Gauge | Per tenant (and related labels such as source and remote repository keys and remote member URL when exposed) |
pq_queue_events_left {queue_name="jfrog_federation_service_queue"} | Number of events remaining to overcome the lag. | Counter | Per tenant |
Event Metrics
The following table lists RTFS event metrics.
| Name | Description | Type | Granularity |
|---|---|---|---|
jfrtfs_events_received_from_artifactory_total | Total events received by the Federation service from Artifactory. | Counter | Per tenant |
jfrtfs_events_removed_in_filter_total | Total deduped events filtered out of the queue. | Counter | Per tenant |
jfrtfs_events_received_from_remote_rtfs_total | Total events received from remote members. | Counter | Per tenant |
jfrtfs_events_sent_to_remote_instance_total | Events sent from the tenant to remote members (includes both RTFS and legacy members). | Counter | Per tenant |
jfrtfs_repo_management_message_blob_duration_between_partition_creations | Duration between partition creations in the message_blob table. | Gauge | Per tenant |
jfrtfs_repo_management_events_duration_between_partition_creations | Duration between partition creations in the events table. | Gauge | Per tenant |
Note
Consider an artifact with two events in the queue for
jfrtfs_events_removed_in_filter_total. In the first event, the artifact is updated and in the second it is deleted. The first event is removed from the queue to streamline the process, and only the deletion event is sent to the remote member.
Full Sync Metrics
The following table lists RTFS Full Sync metrics.
| Name | Description | Type | Granularity |
|---|---|---|---|
jfrtfs_full_sync_e2e_member_execution_seconds_count | Total Full Sync operations executed. | Counter | Per tenant/member |
jfrtfs_full_sync_e2e_member_execution_seconds_sum | Total end-to-end duration of all Full Sync operations. Configure threshold: rfts.full.sync.execution.time.threshold.min (default: 30 minutes, applied per member). | Timer | Per tenant/member |
jfrtfs_full_sync_sort_rate_artifact_per_ms | File list sort rate. Calculated by dividing the number of artifacts in the file list by the total sort time. Configure threshold: rtfs.file.list.sort.rate.threshold.ms.per.artifact (default: 10000 ms) | Gauge | Global |
jfrtfs_full_sync_artifact_events_propagation_rate | Artifact event propagation rate. Calculated by dividing the number of artifact events sent to the remote member by the total time needed to propagate them (elapsed time between sending events and receiving an OK response from the remote member). | Gauge | Global |
jfrtfs_full_sync_file_list_artifacts | Total artifacts in the file list of the local member. Configure threshold: rtfs.file.list.size.metrics.threshold (default: 1 million, if the threshold is exceeded) | Counter | Per tenant/member |
jfrtfs_full_sync_file_list_artifacts_rate_artifact_per_ms | File list compilation rate. Calculated by dividing the number of artifacts in the file list by the total time to compile the file list. Configure threshold: rtfs.file.list.process.rate.threshold.ms.per.artifact (default: 5 seconds) | Gauge | Global |
Member State Metrics
The following table lists RTFS member state metrics.
| Name | Description | Type | Granularity |
|---|---|---|---|
jfrtfs_auto_healing_recovered_members | Total recovery operations performed using auto-healing. For example, recovery performed once on 5 members is equivalent to recovery being performed on the same member 5 times. | Counter | Global |
jfrtfs_members_in_status | Current number of members in each state: FULL_SYNC_RUNNING, FULL_SYNC_PREPARING, PENDING_FS, IMPORT_IN_PROGRESS, FOR_REMOVAL, READ_ONLY, ERROR_GENERIC, ERROR_OUT_OF_SYNC, ERROR_INACTIVE. For the three ERROR_* states, this gauge counts SaaS-target members only. Disabled members are filtered out. | Gauge | Per tenant |
jfrtfs_members_in_status_target_sh | The same states as in jfrtfs_members_in_status, but for the three ERROR_* states only, scoped to self-hosted-target members. This gauge is for observability dashboards, not production alerting. Don't sum this with jfrtfs_members_in_status. | Gauge | Per tenant |
jfrtfs_disabled_members | Total members disabled locally by the user. | Counter | Per tenant |
These states correspond to the definitions in Member State Reference.
Miscellaneous Metrics
The following table lists miscellaneous RTFS metrics.
| Name | Description | Type | Granularity |
|---|---|---|---|
jfrt_rpc_response_from_rtfs_total {statusCode!=200} | Total HTTP errors between Artifactory and the Federation service. | Counter | Global |
jfrtfs_db_failed_query_count_total | Total failed database queries in the Federation service. | Counter | Global |
jfrtfs_db_failed_query_count_metric | Total failed database queries. | Counter | Global |
jfrtfs_db_query_duration_metric | Time needed to execute a specific query. | Counter | Depends on query |
jfrtfs_http_client_available | Percentage of available HTTP client connections. | Gauge | Global |
jfrtfs_http_client_leased | Percentage of leased HTTP client connections. | Gauge | Global |
jfrtfs_http_client_pending | Number of pending HTTP client connections. | Counter | Global |
Legacy Federation Metrics
Note
Legacy metrics were introduced in version 7.63.7 and are available for self-managed customers only.
The metrics available for monitoring legacy-federated repositories are based on the Get Federation Mirror Lag Time REST API:
GET api/federation/status/mirrorsLagNote
The following
jfrt_federation_*examples are Artifactory Open Metrics. They are written when federated repository metrics are enabled through the Artifactory system properties for federated repository metrics and appear on Artifactory's Open Metrics scrape. They do not appear on the RTFS/rtfs/api/v1/metricsendpoint. For lag and health signals from the standalone Federation service (RTFS), use thejfrtfs_*metrics in Lag Metrics and the other RTFS tables in this topic.
Warning
The Federation Mirror Lag, Federation Mirror Maximum Lag, Number of Mirrors Exceeding the Sync Threshold, and Number of Federated Repositories Exceeding the Sync Threshold metrics are applicable only to healthy Federations. These metrics ignore Federated repositories that are down or disabled.
Federation Mirror Lag
Records all Federated repositories whose sync lag exceeds the defined threshold:
jfrt_federation_member_lag_total{local_repo_key="example-repo-local", remote_repo_key="test3-repo", remote_url="http://docker.for.mac.localhost:10102/artifactory/"} 5000 1575374691025The measured lag must exceed the minimum threshold value defined in the system property artifactory.federated.metrics.sync.threshold.time.ms.
Federation Mirror Maximum Lag
Records the maximum lag value from among all Federated repositories in milliseconds:
jfrt_federation_max_lag_ms_total 500 1575374698000Number of Mirrors Exceeding the Sync Threshold
jfrt_federation_num_mirrors_exceeding_lag_threshold_total 17 1575374698000Records the total number of mirrors (17 in this example) that have a sync lag larger than the default threshold. If no mirrors have a lag above the threshold, the recorded value is 0.
Number of Federated Repositories Exceeding the Sync Threshold
jfrt_federation_num_repos_exceeding_lag_threshold_total 9 1575374698000Records the total number of distinct Federated repositories (9 in this example) that have a sync lag larger than the default threshold. This value is always equal to or less than the Number of Mirrors Exceeding the Sync Threshold value. If no repositories have a lag above the threshold, the recorded value is 0.
Number of Disabled Federated Members
jfrt_federation_num_members_disabled_total 2 1575374698000Records the number of disabled mirrors (2 in this example), including disabled Federated repositories from the JPD in context as well as disabled remote Federated repositories that are part of any existing Federation from the JPD in context.
Number of Federated Repositories per Status
jfrt_federation_num_repos_status_total{status="healthy"} 232 1575374691025
jfrt_federation_num_repos_status_total{status="out_of_sync"} 22 1575374691025
jfrt_federation_num_repos_status_total{status="error_exhausted"} 13 1575374691025
jfrt_federation_num_repos_status_total{status="pending_fullsync"} 41 1575374691025
Possible statuses: healthy, pending full sync, full sync running, out of sync, exhausted, disabled.
Warning
The Federation Mirror Lag, Federation Mirror Maximum Lag, Number of Mirrors Exceeding the Sync Threshold, and Number of Federated Repositories Exceeding the Sync Threshold metrics are applicable only to healthy Federations. These metrics ignore Federated repositories that are down or disabled.
Federated Repository Metrics in MBeans
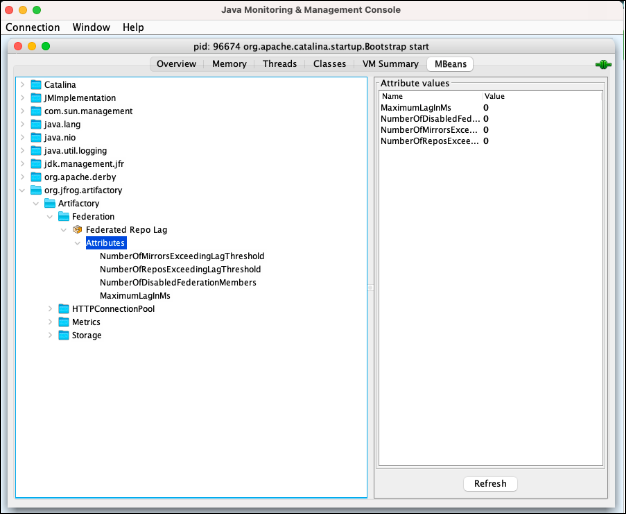
An MBean section for Federated repositories is available whose attributes are identical to the metrics described earlier in this topic:
MaximumLagInMsNumberOfDisabledFederationMembersNumberOfReposExceedingLagThreshold: Requires the Get Federation Mirror Lag Time API to limit the results to those repositories that exceed a defined threshold.NumberOfMirrorsExceedingLagThreshold
Legacy Metrics System Properties
The following Artifactory system properties configure Federated repository monitoring data based on the Open Metrics standard.
| Property | Description | Default |
|---|---|---|
artifactory.federated.metrics.enabled | Determines whether metrics writing for Federated repositories is enabled. | false |
artifactory.federated.metrics.sync.threshold.time.ms | Defines the minimum threshold (in ms) above which the Open Metrics counter indicates a repository has breached the sync threshold. This default value is also the minimum value. | 20000 (20 seconds) |
artifactory.federated.metrics.monitoring.interval.time.sec | Defines the measurement interval for the Federation synchronization of all repositories. The system overrides any defined value under the JFrog-defined minimum (currently 5 seconds) to protect the system. | 30 seconds |
artifactory.federated.metrics.exclude.disabled | Determines whether to exclude disabled mirrors (whose sync lag, by definition, is always increasing) from metrics writing. | true |
artifactory.federated.metrics.enable.count.disabled.members | Determines whether to count the number of disabled members across all existing Federations in the JPD. | true |
For additional setup and configuration details, see System Properties Reference.
Related Topics
Updated 16 days ago